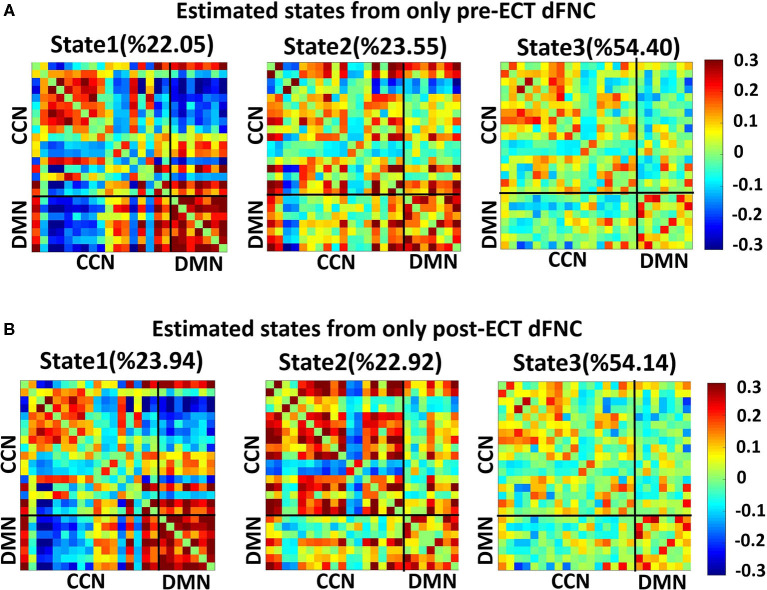
Figure 2.
Dynamic functional connectivities in three identified states, using the clustering method, the input of clustering is combined with dFNC of all individuals (both HCs and DEPs). Each state consists of a 24 × 24 matrix where the positive connectivities are shown by hot color and negative connectivities are shown with cold colors. The values in parentheses show the overall percentage of time the participants spent in each specific state. (A) States resulted from clustering analysis of pre-ECT dFNC. (B) States resulted from clustering analysis of post-ECT dFNC.

