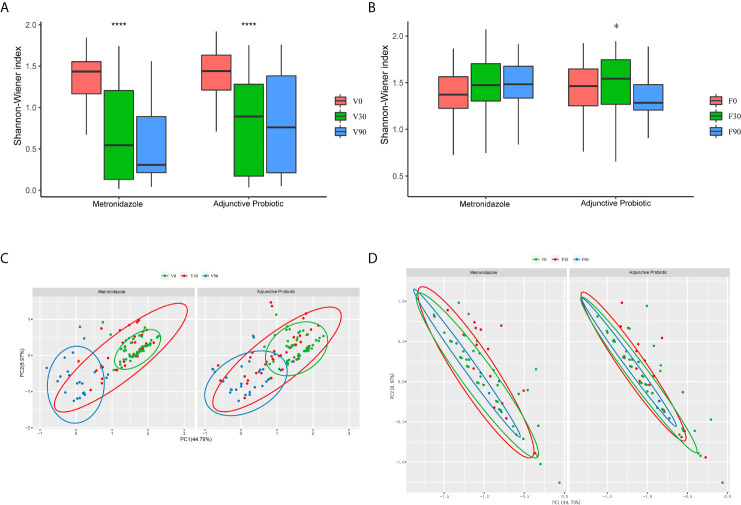
Figure 3.
The microbial diversity of the vaginal and fecal samples. The α-diversity of the vaginal (A) and fecal (B) microbiota presented by the box-plot of Shannon-Winner index. Wilcoxon test was used to do the statistical analysis of each two independent groups and Krustal test for multiple groups. The asterisks indicated the difference of multi-group. They denote the significant difference among all the three bars below. *stands for p-value < 0.05; ****stands for p-value < 0.0001. Principal coordinate analysis (PCoA) of the vaginal (C) and fecal (D) samples was also performed. Each dot represents one individual sample, and the green ones stands for those collected at baseline, while red for 30 days and blue for 90 days.

