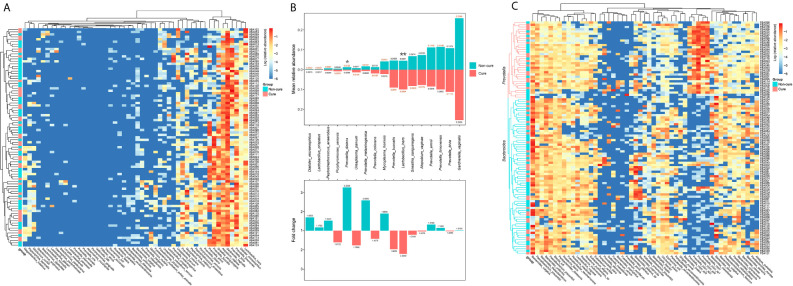
Figure 6.
The hierarchical cluster of the vaginal and fecal microbiota of the participates at 0-day. The heatmap of the hierarchical cluster analysis of the bacterial species with relative abundance above 0.001 in vaginal (A) and fecal (C) microbiota of each participants. The colour was corresponded with the colour bar at right side defined by log of the relative abundance. The left bar was represented the cure (red) and non-cure (blue) outcome of the participants. The relative abundance of the bacterial species above 0.01 in vaginal microbiota in cure group and non-cure group, and their multiple relationship were also calculated (B). The number marked at the end of the bar in the upper plot was the mean relative abundance, and the number in the lower plot was the fold change. Wilcoxon test was used to do the statistical analysis of each two independent groups, and p-value was noted by stars above the bars. *stands for p-value < 0.05; **stands for p-value < 0.01.

