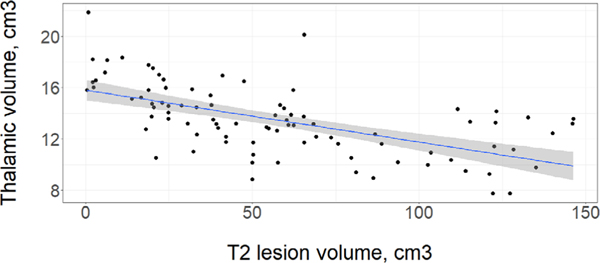
FIGURE 6:
Thalamic volume plotted along with white matter T2 lesion volume. Linear model shown with a best-fit line (blue) and a 95% confidence interval (shaded in in grey). A significant correlation was found between with T2 lesion volume and thalamic volume, adjusted r2 = 0.23 (p < 0.0001), Spearman’s rho = − 0.65 (p < 0.0001). [Color figure can be viewed at www.annalsofneurology.org]

