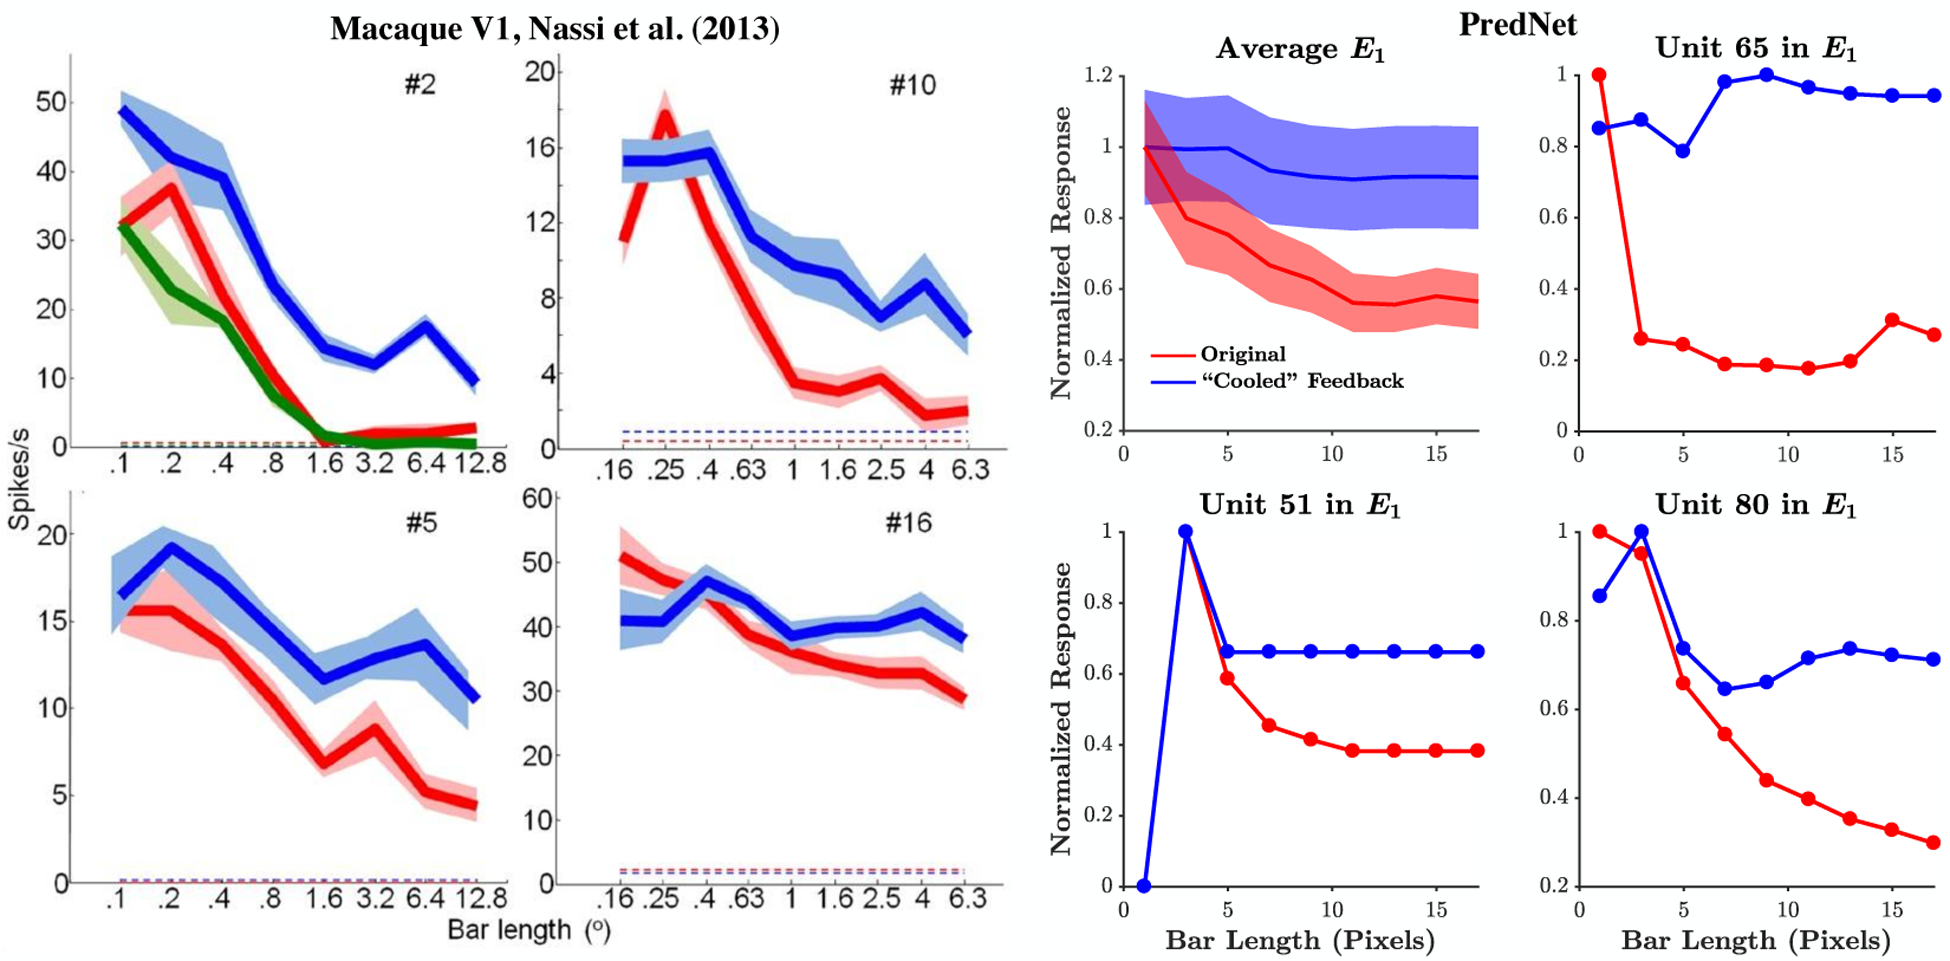
Figure 2:

Length suppression. Left: Responses of example macaque V1 units to bars of different lengths before (red), during (blue), and after (green) inactivation of V2 via cryoloop cooling [reproduced from Nassi et al. [53]; dashed lines indicate spontaneous activity]. Right: PredNet after training on the KITTI car-mounted camera dataset [13] - Mean over E1 filter channels (± s.e.m.) and examples. Red: Original network. Blue: Feedback weights from R2 to R1 set to zero. We note that, in the PredNet, the “after” inactivation response (green trace in neural data) would be equivalent to the “before” inactivation response (blue). See Extended Data Fig. 1 for responses of A and R units.
