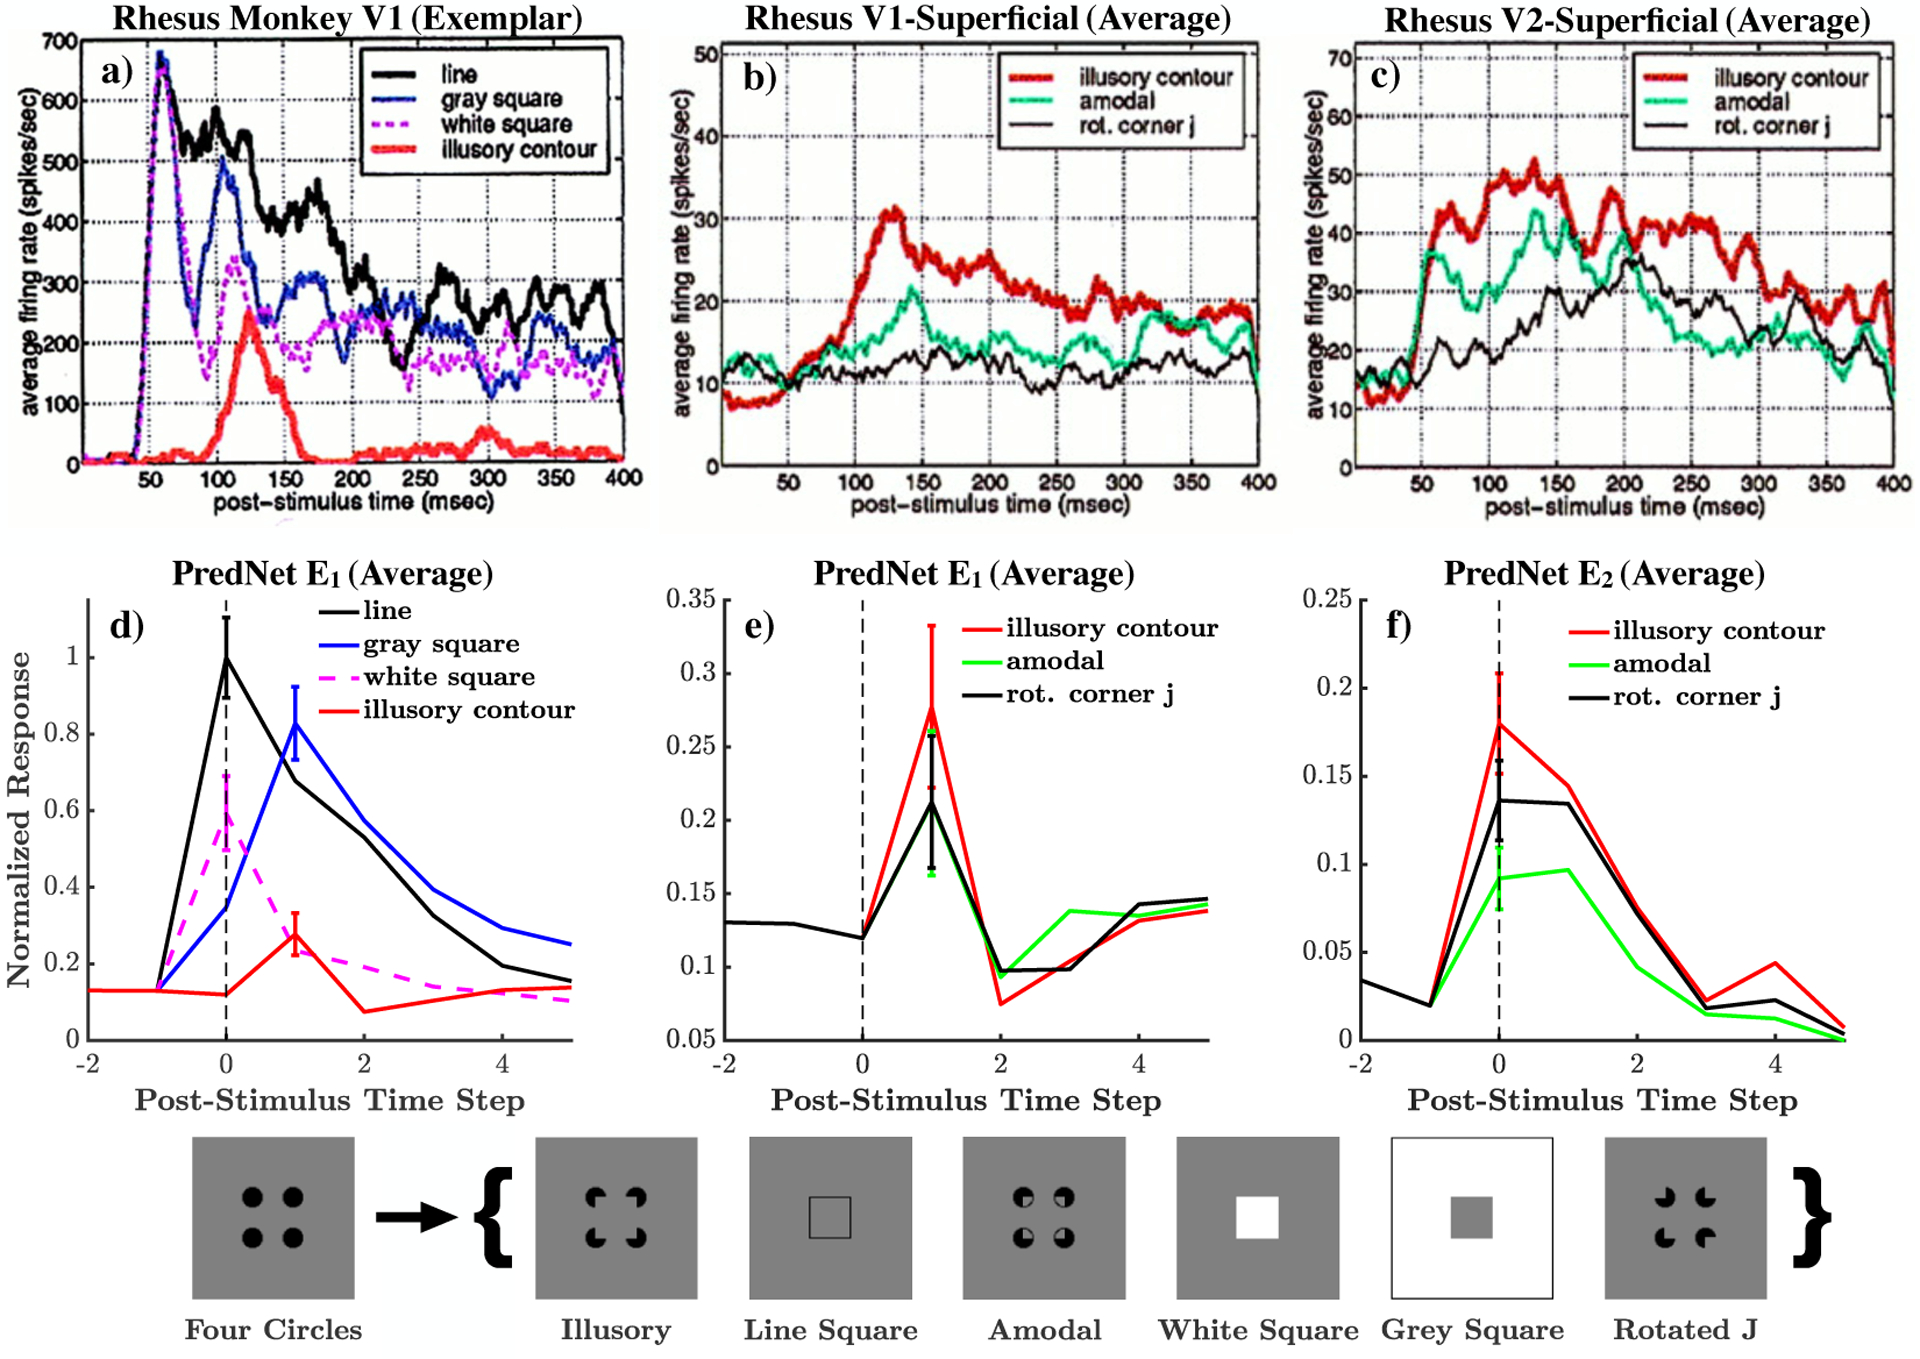
Figure 5:

Illusory contours. Top: Data from electrophysiological recordings in the rhesus monkey [reproduced from Lee and Nguyen [59], Copyright (2001) National Academy of Sciences, U.S.A.]. Below: PredNet responses. a) An exemplar V1 neuron which exhibits a response to the illusory contour, at an increased latency compared to stimuli with true contours. b) V1 population average demonstrates a larger response to the illusory stimuli, compared to similar, control stimuli. c) V2 population average response is also larger for the illusory stimuli, and demonstrates an earlier latency than the V1 average. d) The PredNet E1 average activity also demonstrates a response to the illusory contour, at an increased onset latency compared to true contours. e) The E1 average response is moderately larger for the illusory contour than the control stimuli. f) The PredNet E2 response is also moderately larger for the illusory stimuli, with an earlier latency than E1. PredNet averages were computed across filter channels at the central receptive field. Error bars represent s.e.m. Bottom: Illustration of the stimuli and the presentation paradigm, using the nomenclature proposed by Lee and Nguyen [59]. For each trial in the monkey and PredNet experiments, the “four circles” stimuli is first presented, followed by one of the test stimuli (in brackets). See Extended Data Fig. 4 for the responses of the A and R units.
