Fig. 1.

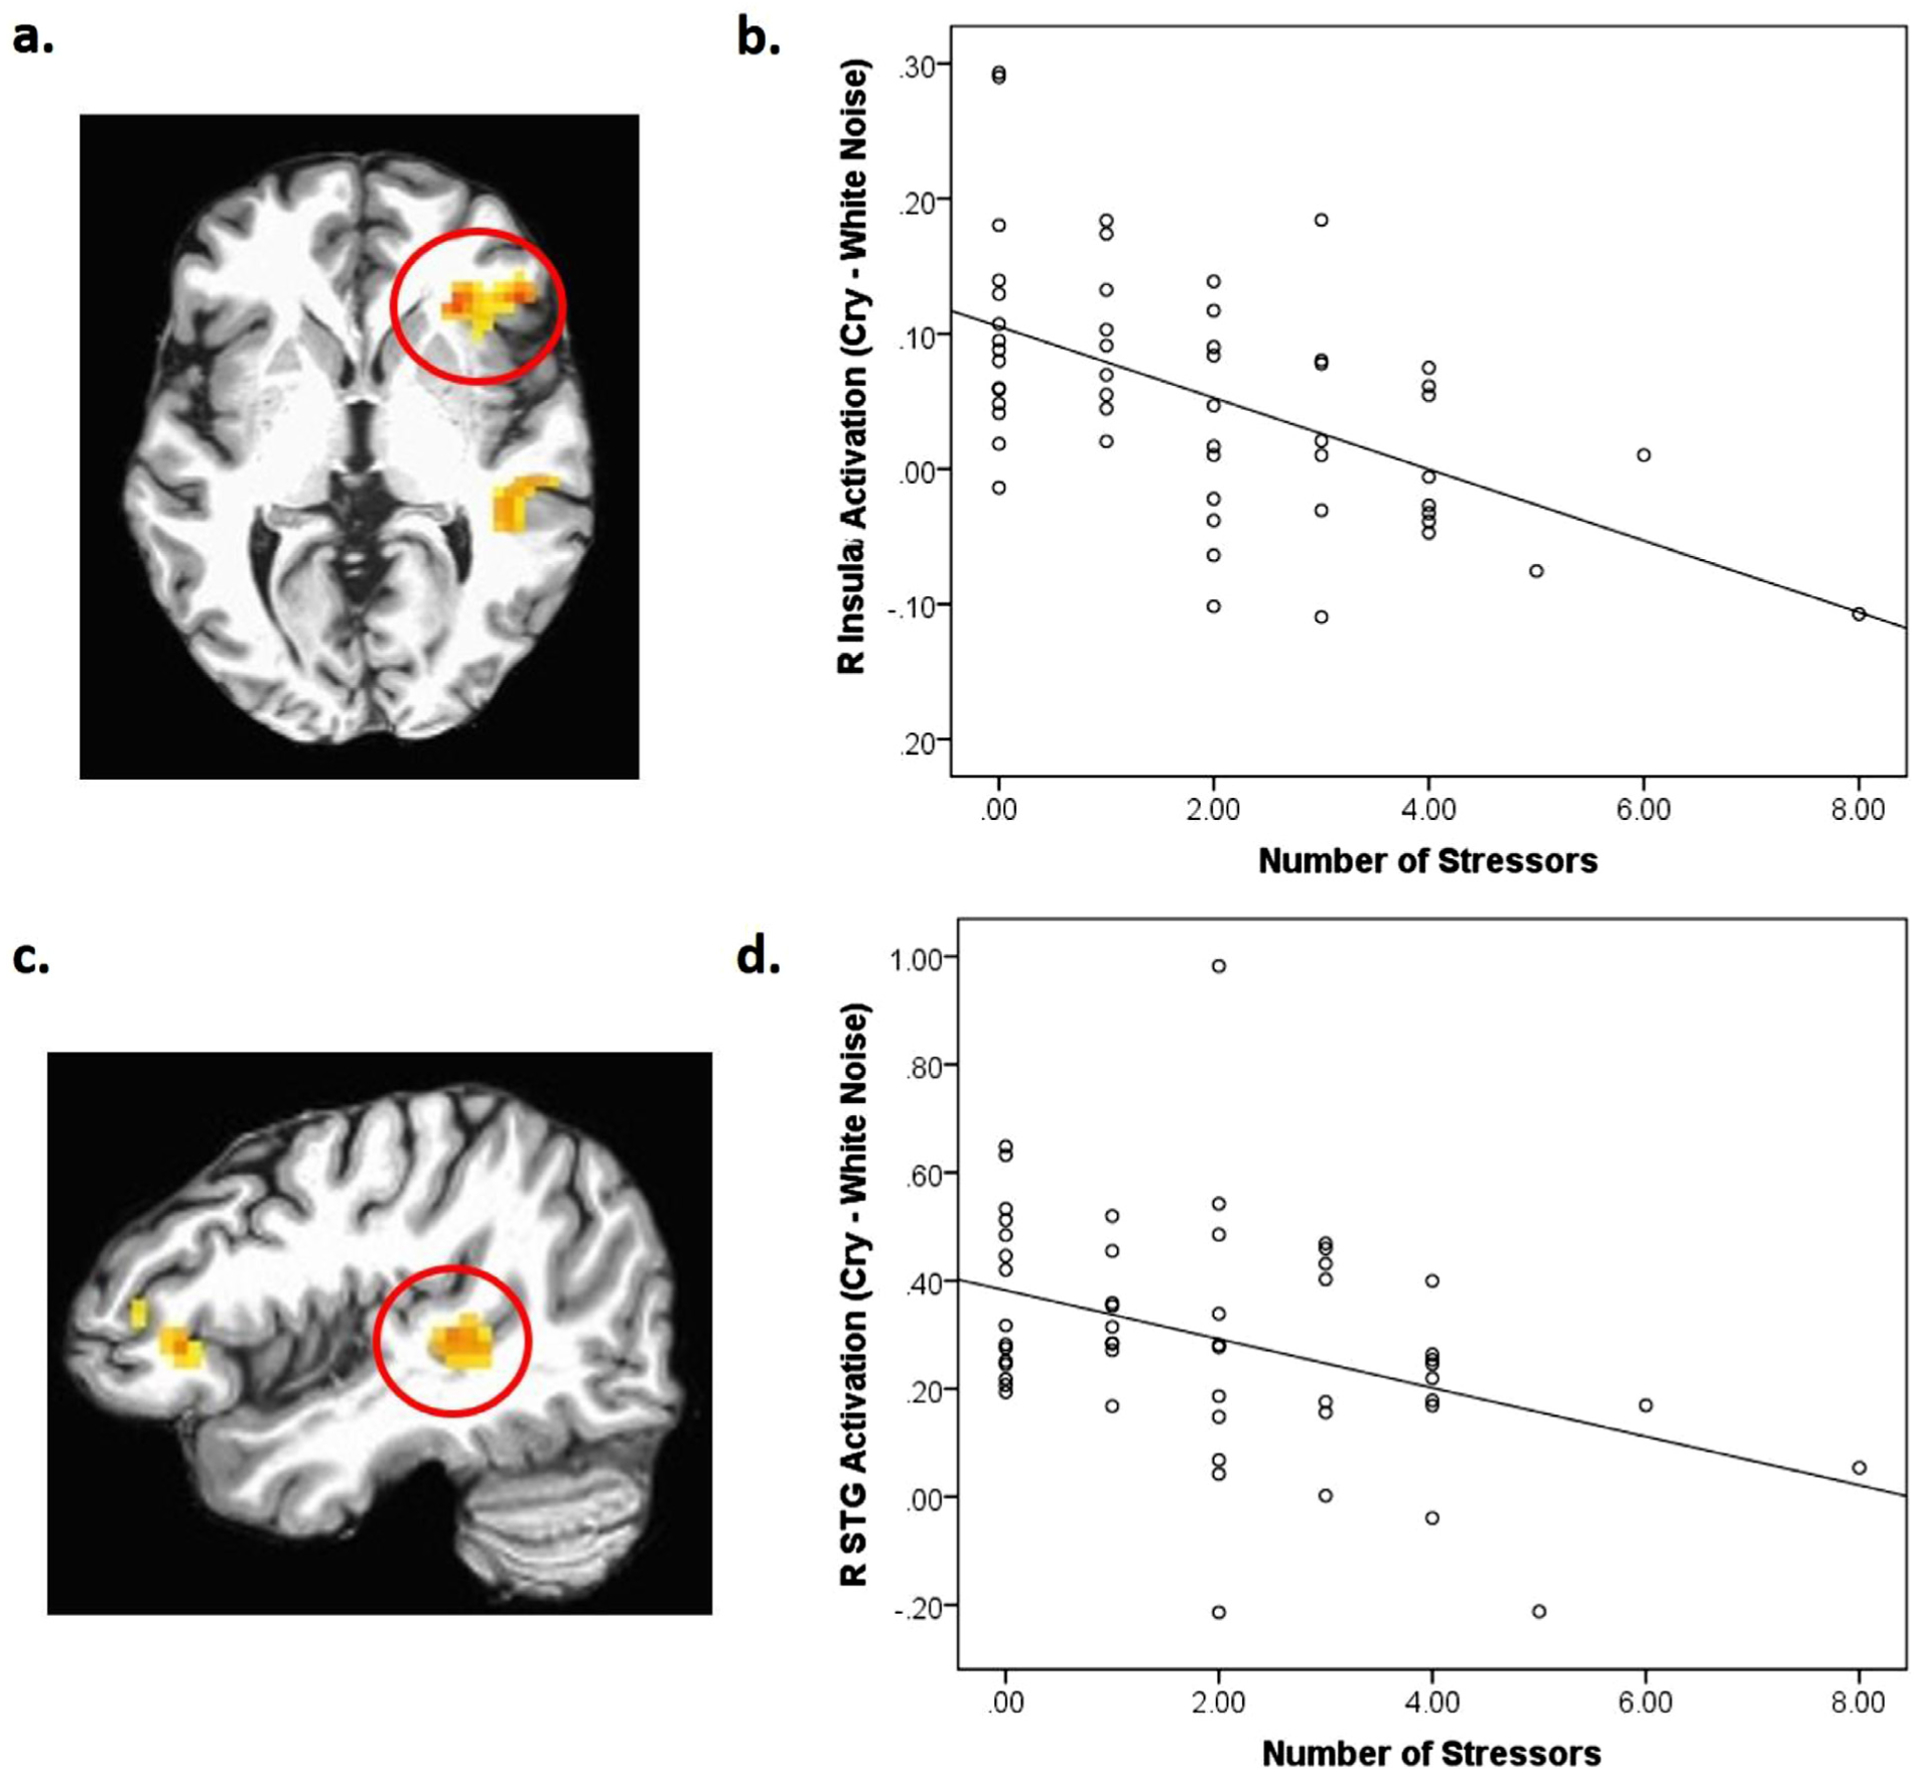
(a) The right (R) insula cluster (BA47; x, y, z = 29, 26, 2; k=86) which also included a part of the inferior frontal gyrus (IFG) in a red circle showing stress exposure X sound interaction, p < 0.05, corrected; (b) scatterplot describing the negative associations between stress exposure and brain responses to infant cry sounds (both own and control infant cry sounds) in the region; (c) The right (R) superior temporal gyrus (STG) (BA41; x, y, z = 44, −31, 5l; k=39) in a red circle showing stress exposure X sound interaction, p < 0.05, corrected; (d) a scatterplot describing the negative associations between stress exposure and brain responses to infant cry sounds (both own and control infant cry sounds) in the region.
