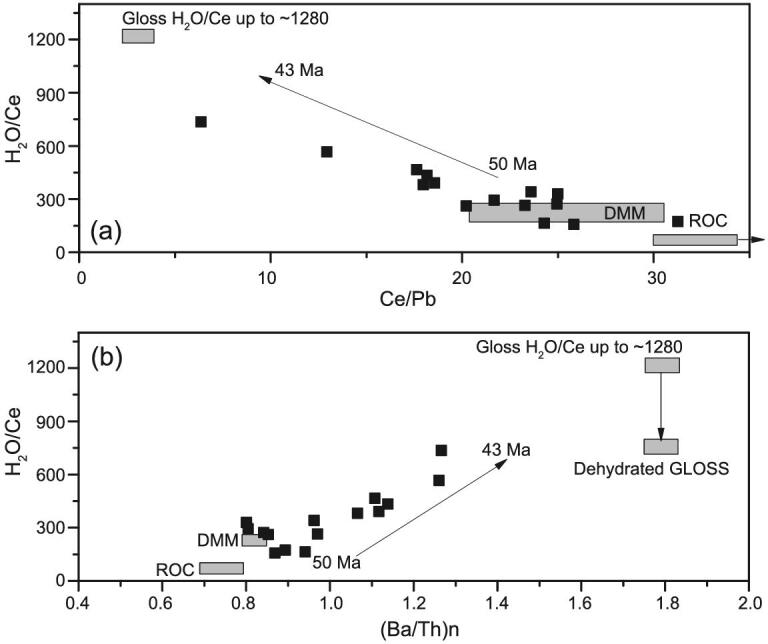
Figure 11.

Correlations among H2O/Ce of the Cenozoic Shuangliao basalts and the bulk rock trace elemental ratios and radiogenic isotopic compositions. Gray squares represent the possible end members in the mantle source. Modified from Chen et al. [29].
