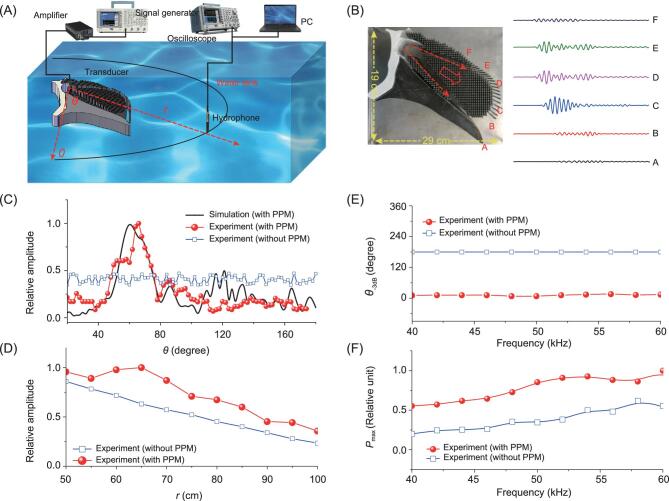
Figure 3.
Experimental validation of the directional PPM system. (A) Systematic diagram of the experimental setup. (B) Measured pressure distribution at positions A, B, C, D, E, and F of the PPM surface. (C) Experimentally measured and numerically simulated pressure distributions with respect to angle θ of the device with and without PPM. (D) Measured main lobe amplitude with respect to distance r of the device with and without PPM. (E) Frequency responses of the beam widths of the devices. (F) Frequency responses of the main lobe amplitudes of the devices.

