
Figure 5.
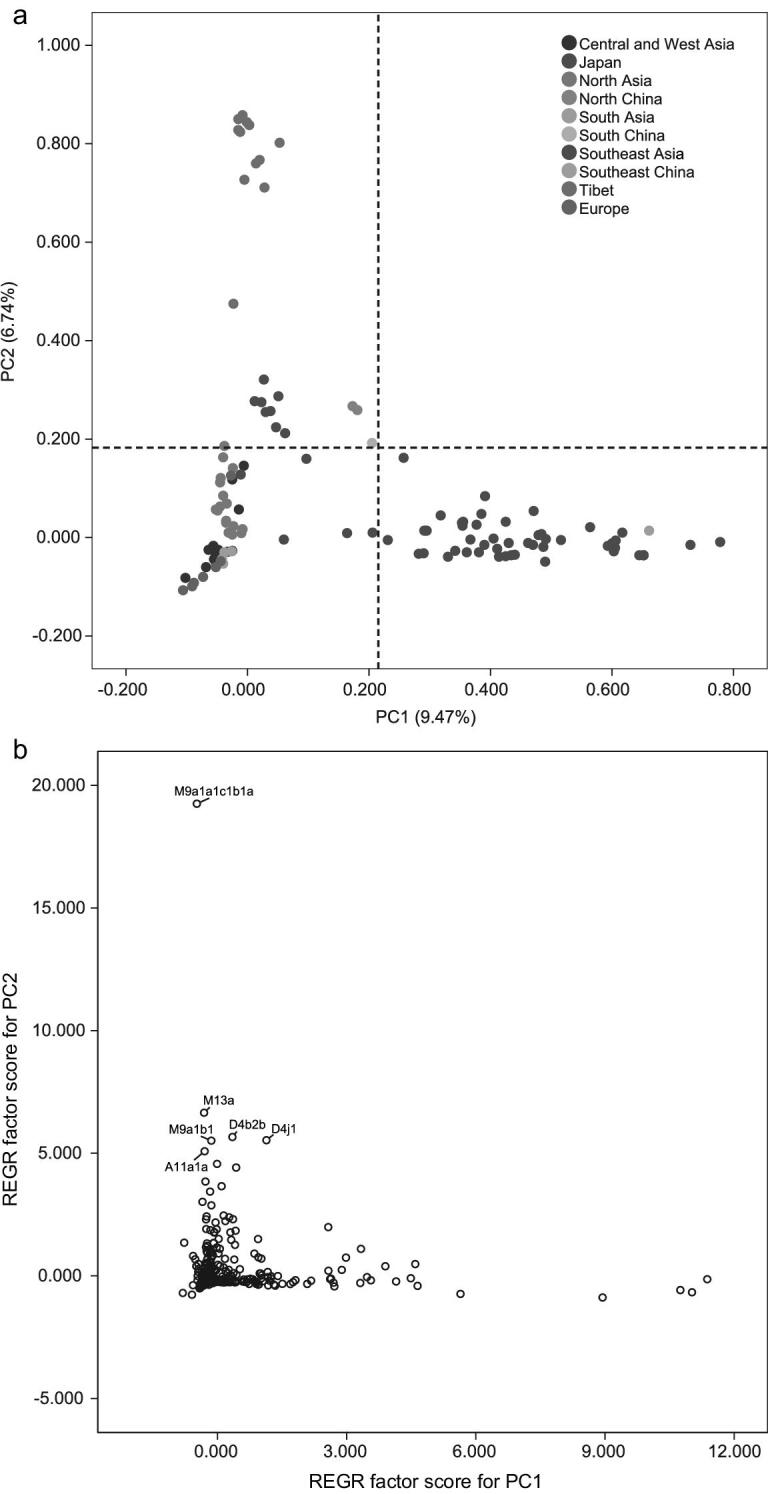
PCA of Tibetans and other Eurasian populations based on whole mitochondrial genome data. (a) PC map of 120 populations based on haplogroup frequencies. Populations from different regions are indicated by different colors. (b) Plot of haplogroup contribution of first and second PCs. Contribution of each haplogroup was calculated as the factor scores for PC1 and PC2 with REGR in SPSS.