Figure 7.

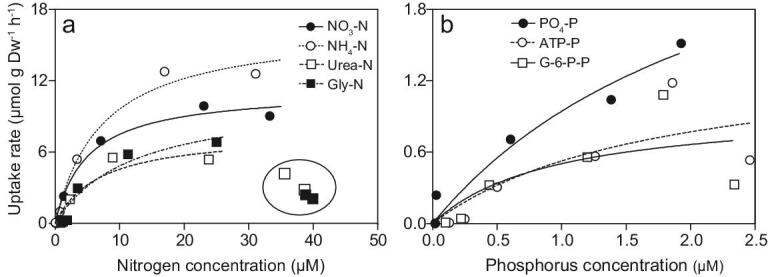
The concentration-dependent uptake rates of (a) dissolved nitrogen and (b) phosphorus of U. prolifera during an incubation experiment (modified from [70]). The fitting curves excluded the circled data points.

The concentration-dependent uptake rates of (a) dissolved nitrogen and (b) phosphorus of U. prolifera during an incubation experiment (modified from [70]). The fitting curves excluded the circled data points.