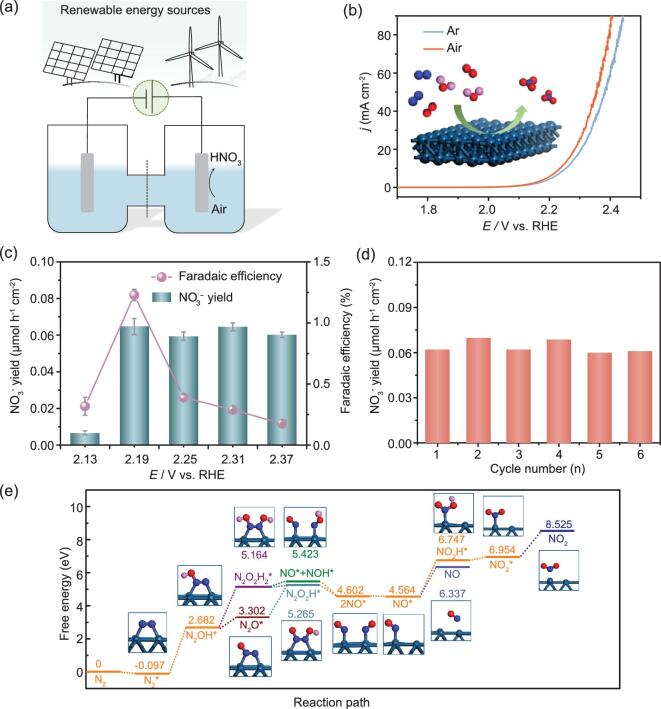
Figure 1.
(a) Schematic illustration for as-proposed Strategy I. (b) Linear sweep voltammetric curves of platinum foil in Ar-saturated (blue line) and air-saturated (red line) electrolyte. (c) Yields of  and Faradaic efficiencies after potentiostatic test at given potentials. (d) The cycling tests of N2 electrooxidation over the same piece of Pt electrode. (e) Calculated free-energy diagram for N2 electrooxidation over platinum foil. Ball-and-stick model in (b) and (e): blue ball (N atom), red ball (O atom), pink ball (H atom) and green ball (Pt atom).

