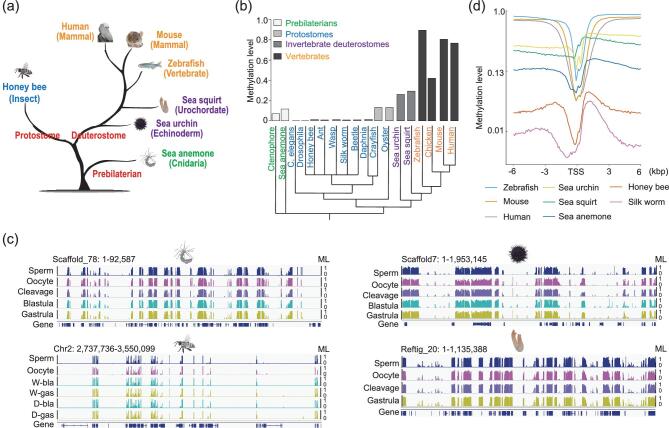
Figure 1.
Conservation and divergence of global methylation patterns in animals. (a) Evolutionary tree of animal species used in this study. (b) Global average methylation levels across different animals. Cluster under bars represents evolutionary tree of animals which is derived from the Time Tree (http://timetree.org/). (c) Genomic snapshots (IGV) displaying mosaic methylation pattern in invertebrates. ‘W’ means worker bee. ‘D’ means drone bee. ‘bla’ means blastoderm. ‘gas’ represents ‘gastrula’. Vertical line height indicates the methylation level (ML). (d) Variation of methylation levels across 6 kb upstream and downstream of transcription start sites (TSSs) in sperm (methylation levels were calculated for every 100-bp bin).

