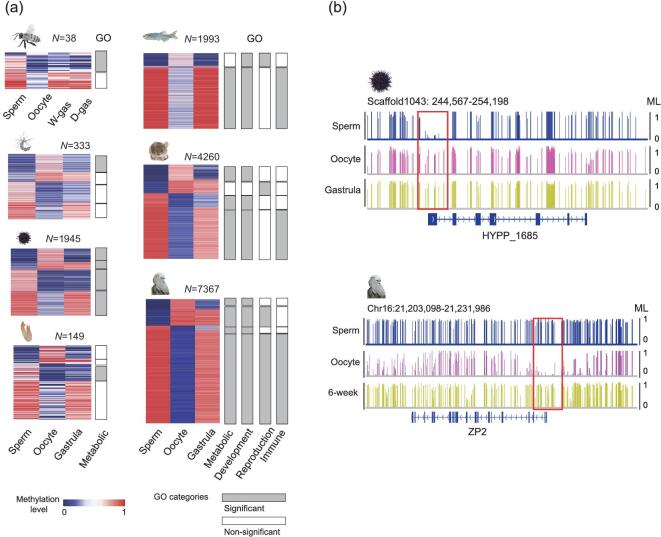
Figure 3.
Evolution of promoter reprogramming in animals. (a) Heatmaps of differentially methylated promoters between sperm and oocytes across different species. Gene ontology (GO) enrichment of genes with differentially methylated promoters was performed. The color key from blue to pink indicates the DNA methylation levels (MLs) from low to high, respectively. (b) Genomic snapshot shows reprogramming of promoters in sea urchin and human. Red boxes highlight the promoter regions.

