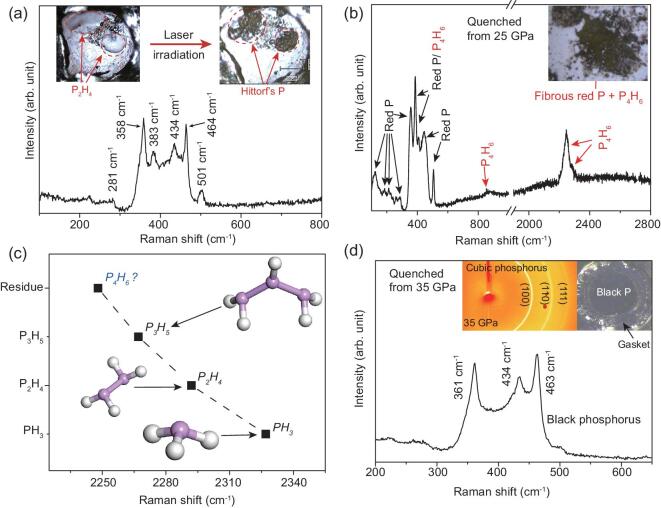
Figure 2.
(a) The Raman spectrum of the Hittorf's phosphorus transformed from the liquid sample after laser irradiation. The inset images show the photo-induced transition of the liquid residue before and after laser irradiation. (b) The Raman spectrum of the sample decompressed from 25 GPa. The inset picture shows the optical micrograph of the decompressed sample. (c) The frequency trend of the P–H stretching in PnHn+2 (n = 1, 2, 3 and 4). (d) The Raman spectrum of the sample quenched from 35 GPa. The inset shows the XRD pattern of the sample at 35 GPa and the optical micrograph of the decompressed sample.

