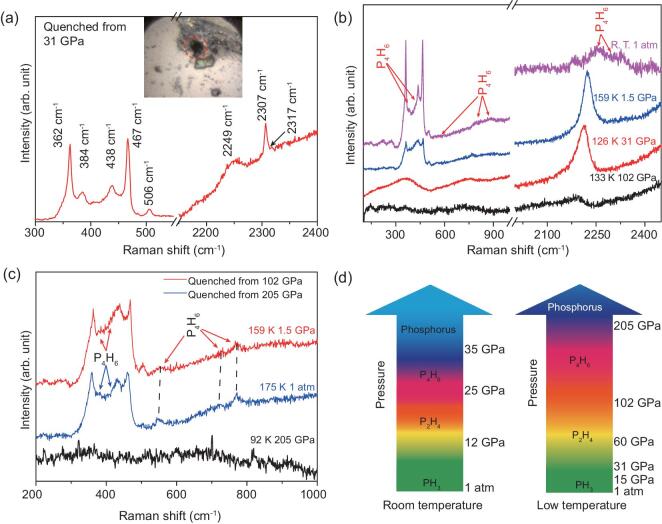
Figure 3.
(a) The Raman spectrum of the sample quenched from 31 GPa. The inset image shows the photo-induced transition after laser irradiation. (b) The Raman spectra of the sample collected during decompression from 102 GPa. (c) The Raman spectra of the residue quenched from 205 (blue line) and 102 (red line) GPa, respectively. (d) The phase diagrams of PH3 at room temperature and low temperature.

