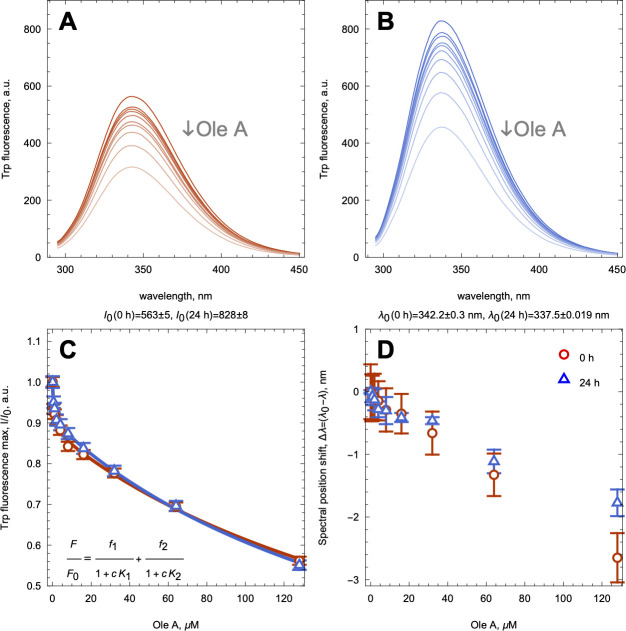
Figure 5.
Interaction of native and amyloid S100A9 with OleA monitored by intrinsic fluorescence. Fluorescence spectra of native (A) and amyloid (B) S100A9 upon increasing concentrations of OleA. (C) Relative fluorescence intensities at the spectral maximum of native (blue triangles) and amyloid (red circles) S100A9 upon increasing OleA concentrations. Fitting curves are shown by solid lines in the corresponding color. The two binding site model is shown in the inset. (D) Shifts of fluorescence spectral maxima of native and amyloid S100A9 determined by the first derivative method upon increasing OleA concentrations shown in the same symbols as in (C). Four μM S100A9, PBS, pH 7.4, and 42 °C.

