Figure 6.
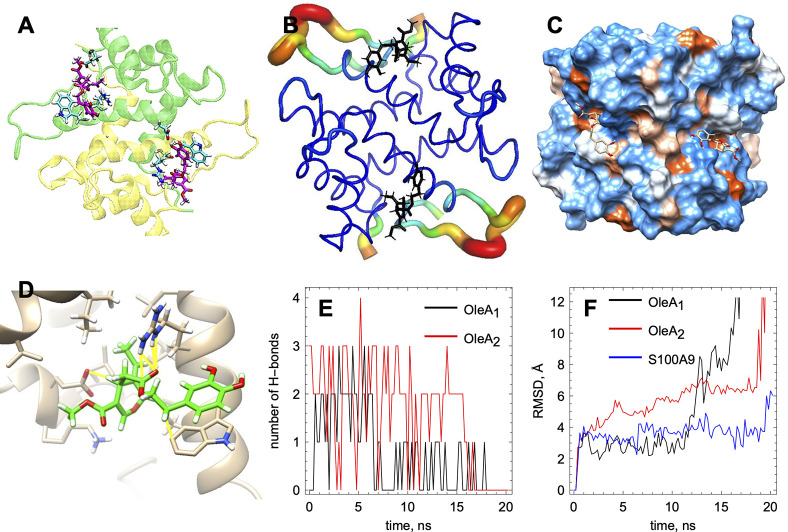
MD simulation of the interactions of native S100A9 with OleA. (A) Binding of one OleA molecule per subunit of S100A9 dimer. S100A9 monomers are shown by the ribbon diagram in yellow and green colors, respectively. The amino acid side chains of S100A9, which form binding interactions with OleA, are shown by cyan sticks. OleA molecules are shown by magenta sticks. OleA forms hydrogen bonds with Glu 52 and Arg 85 and π–π stacking interactions with Trp 88. (B) B-factor presentation of the S100A9 dimer backbone shows that OleA (in black sticks) binds to the protein site with low mobility (shown in blue). The loops with high mobility are shown by thicker tubes with a color gradient from yellow to red, corresponding to increasing mobility. (C) S100A9 dimer surface presentation in space filling and colors based on the polarity of the amino acid residues: hydrophilic residues, blue; hydrophobic residues, brown; residues with intermediate properties, white. OleA (shown by sticks) binds to a shallow hydrophobic cavity on the S100A9 surface. (D) Detailed presentation of the OleA orientation and binding interactions (presented in yellow) highlighting: π–π stacking between Trp 88 and OleA, hydrogen bonding between Arg 85 and the carbonyl oxygen of OleA, and the proximity between Glu 52 and the ester group of OleA. (E) Number of hydrogen bonds between each OleA molecule and S100A9 dimer. OleA molecules dissociate when the number of hydrogen bonds falls to zero. Hydrogen bonds were defined as the interactions between the polar groups with an angle of less than 20° and less than 3.0 Å distance. (F) Root mean square deviation (RMSD) values demonstrating the mobility of each OleA molecule and S100A9 dimer. Ligand dissociation results in the rapid increase in the RMSD values.

