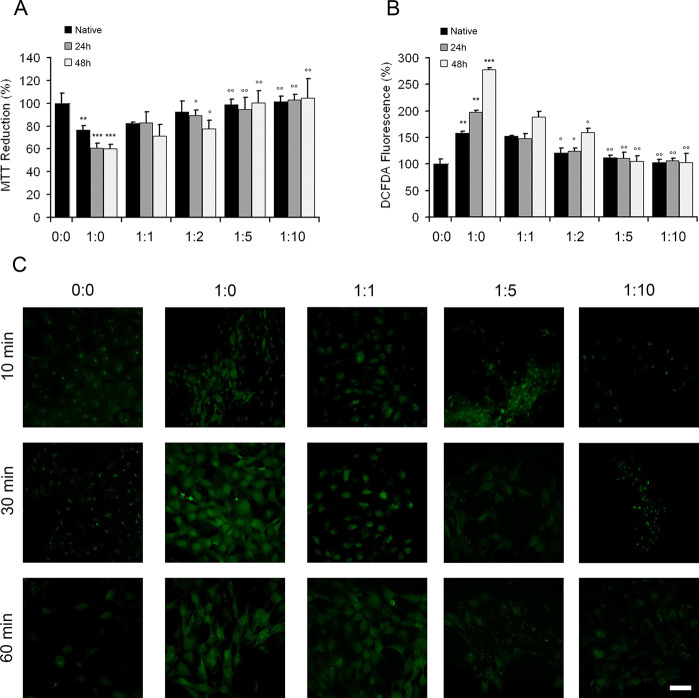
Figure 7.
Cytotoxic effect of the S100A9 amyloids in the SH-SY5Y cells is mitigated by OleA. (A) Viability of SH-SY5Y cells measured by the MTT assay and (B) ROS levels in the SH-SY5Y cells measured by DCFDA fluorescence. Cells were exposed to 20 μM S100A9 samples for 24 h. S100A9 was added in either native or amyloid forms, which were incubated for 24 and 48 h in PBS, pH 7.4, at 42 °C, respectively, prior the addition to the cells. S100A9 to OleA molar ratios were 1:0, 1:1, 1:2, 1:5, and 1:10 as indicated along x-axis. The control corresponds to the untreated cells and is shown by a single black bar, where the absence of S100A9 and OleA is indicated as (0:0). The experimental bars corresponding to the addition of native S100A9 are shown in black, the addition of 24 h aged S100A9 amyloids are shown in gray, and the 48 h aged amyloids are shown in white. Error bars indicate the standard error of the mean of the independent experiments carried out in triplicate. ***p < 0.001 and **p < 0.01 versus control (0:0). °p < 0.05 and °°p < 0.01 versus cell viability in the presence of native or the corresponding aggregated S100A9 without OleA, i.e., molar ratio (1:0). (C) Confocal microscopy imaging of the intracellular free Ca2+ levels in the SH-SY5Y cells exposed for 10, 30, and 60 min to 20 μM S100A9 amyloids incubated for 48 h in the absence or in the presence of OleA at the molar ratios of S100A9 to OleA indicated in the figure. Scale bars are 14 μm in all images.

