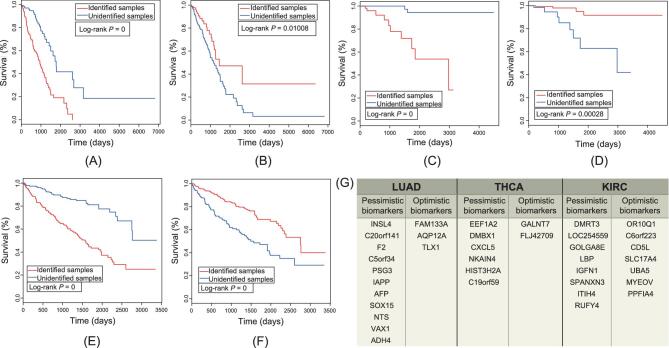
Figure 4.
Comparison of survival curves for pessimistic and optimistic biomarkers identified for three cancers: (A) pessimistic biomarkers for LUAD; (B) optimistic biomarkers for LUAD; (C) pessimistic biomarkers for THCA; (D) optimistic biomarkers for THCA; (E) pessimistic biomarkers for KIRC; (F) optimistic biomarkers for KIRC. Pessimistic or optimistic biomarkers in the DNB are indicated by ‘Identified sample’, while ‘Unidentified sample’ refers to other samples. (G) Genes representing pessimistic and optimistic biomarkers for LUAD, THCA and KIRC disease states.

