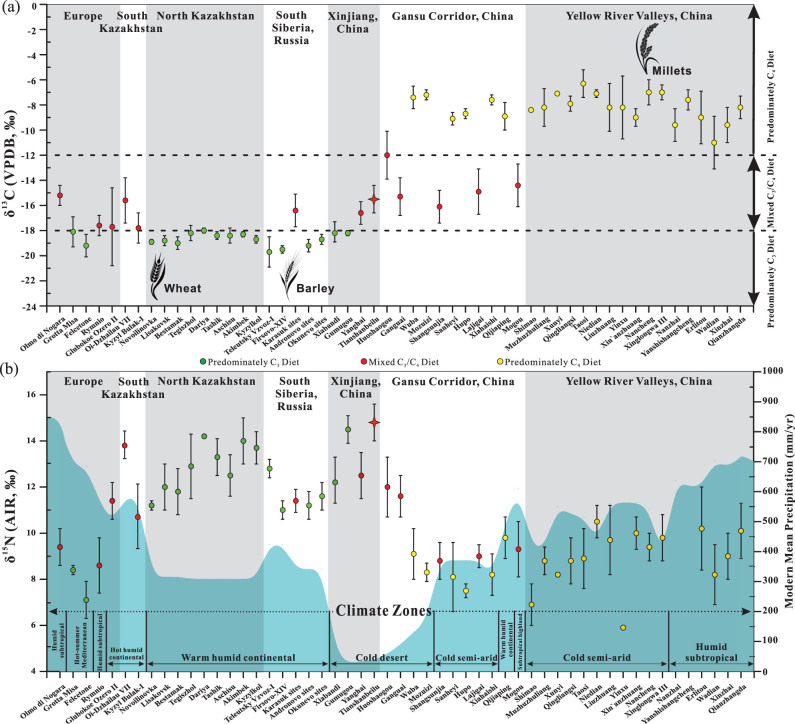
Figure 4.
Mean ± SD human δ13C (a) and δ15N (b) results from all Bronze Age sites surveyed along the Isotopic Millet Road. For detailed results and references, see Tables S2 and S3 (available as Supplementary Data at NSR online). Elevated δ15N values at western Gansu Corridor and Xinjiang sites are likely influenced by the increased aridity of the Taklamakan Desert and modern mean annual precipitation and general climate zones are shown in (b). Note: measurements > –12‰ reflect a predominately C4 diet, values between –12‰ and –18‰ indicate a mixed C3/C4 diet and values < –18‰ reflect a predominately C3 diet in China [39,76].

