Figure 1.
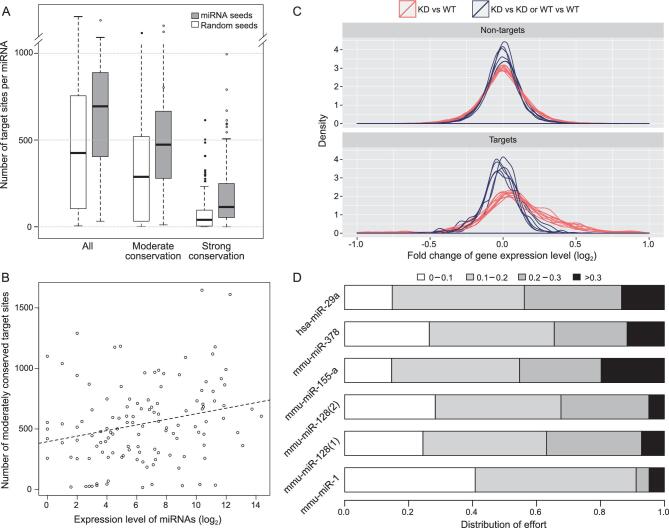
Predicted target number in relation to the observed derepression by miRNA knockout. (A) Number of miRNA target genes predicted by TargetScan (grey bars) vs. control (white bars) based on the shuffled seeds of the same miRNAs. The comparison is done at three levels of evolutionary conservation (see also Figure S1-A, B). (B) Correlation between the expression level of 109 miRNA seeds and the predicted number of moderately conserved targets. The correlation is positive but the slope is very small (see text and also Figure S1C, D). (C) Distribution of fold change in the expression of target genes in miRNA (hsp-29a) knockout lines between experiments and controls (red lines) and between controls (blue lines). The median increase upon miRNA knockout is <10%. (See also Figure S2). (D) DOE on target repression by each of 6 miRNAs. These efforts are categorized into four levels depending on the effect of repression, ranging from <10% to >30%. DOE sums up the repressions across all target genes, weighted by their expression level. Strong repression of >30% generally takes up ∼10% of a miRNA’s repression capacity.

