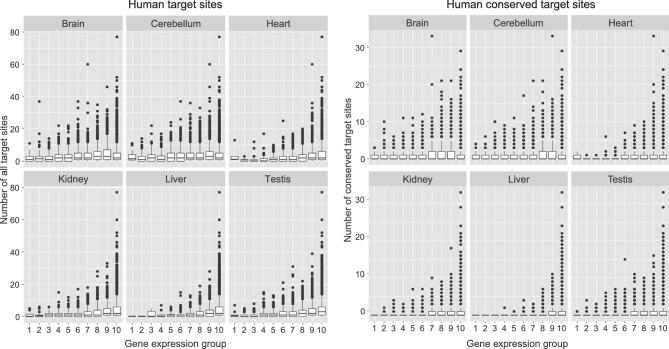
Figure 3.
Number of miRNA target sites on genes with different levels of expression, ranging from high to low from left to right in 10 different groups, each containing 10% of all genes. The left sets of panels are analyses of all targets of 109 miRNA seeds, and the right sets of panels are those of conserved targets. Analyses of two different levels of evolutionary conservation are shown but the pattern is observable in all (see Supplementary Data). For each level, six tissues are analyzed. Note that very highly expressed genes appear to avoid having a very large number of target sites. (See also Figure S3).

