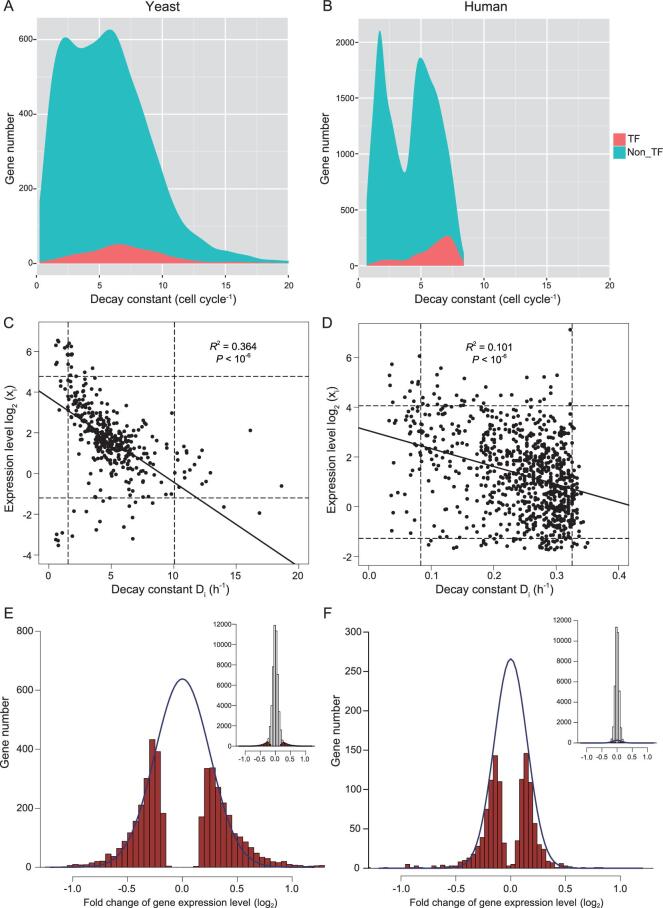
Figure 4.
Measurements of degradation and interaction in GRNs. (A, B) Density plot of Di (mRNA decay constant). TFs (shaded in red) have higher degradation rates than the rest of the transcriptome (blue). The rates shown are calibrated by the respective cell cycle time, by which the two systems are comparable in degradation. In actual time, yeast mRNAs are degraded 17 times faster than human mRNAs. (C, D) The relationship between the expression level of mRNAs and the decay constant. The y-axis spans three orders of magnitude while the x-axis spans only one order. Hence, the expression level of genes is only marginally affected by the degradation constant. The dotted lines mark 5% and 95% of the distribution. In this restricted range, Y also varies more than X by 10 fold. (E, F) Distribution of the interaction strength between genes in yeast and human GRN. The strength is the change in the abundance of mRNA of gene i upon the knockout (yeast) or knockdown (human) of gene j. Significant changes (P < 0.001) are marked in red and approximated by a normal distribution marked by the blue line. The inset displays this portion of significantly changed genes relative to all genes.

