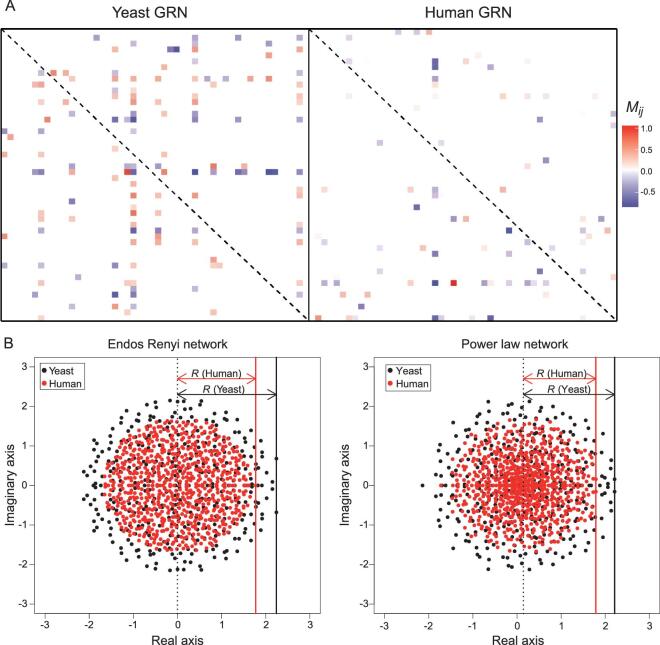
Figure 5.
The interaction matrix (M) and its eigenvalues. (A) A random 50 × 50 block of the interaction matrix, M, is shown for the yeast and human GRNs. Off-diagonal elements that are significantly positive or negative (see Fig. 4E and F) are indicated by a color of the heatmap. Diagonal elements are not shown (marked by the dashed line). Note that the yeast GRN is slightly denser than the human GRN. (B) Distribution of the eigenvalues of GRNs, which are complex numbers with real and imaginary parts. The GRN is constructed with the parameters obtained from the measurements of Fig. 4, with the off-diagonal elements following a normal distribution (Fig. 4E and F) and the diagonals set to zero. Two different network structures (random network and power-law) are modeled but the outputs are similar. The leading eigenvalue, marked by a solid vertical line, has a value of R (see equations (8) and (10)). The GRN stability requires that R–D < 0.

