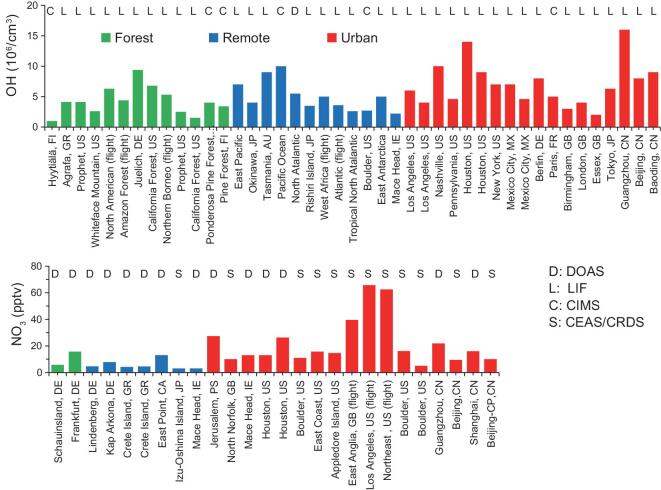
Figure 2.
Typical observed daily averaged maximum OH concentrations and night-time averaged NO3 concentrations at distinct different geophysical regions (i.e. urban, remote, forest areas) with different measurement techniques (i.e. DOAS, LIF, CIMS, CEAS and CRDS). The summary of OH is an extension of Fig. 2 of Lu and Zhang [35], while that of NO3 is an extension of Fig. 3 of Wang et al. [36]. The results of Jiangmen (a rural site in Pearl River Delta) are unpublished observations.

