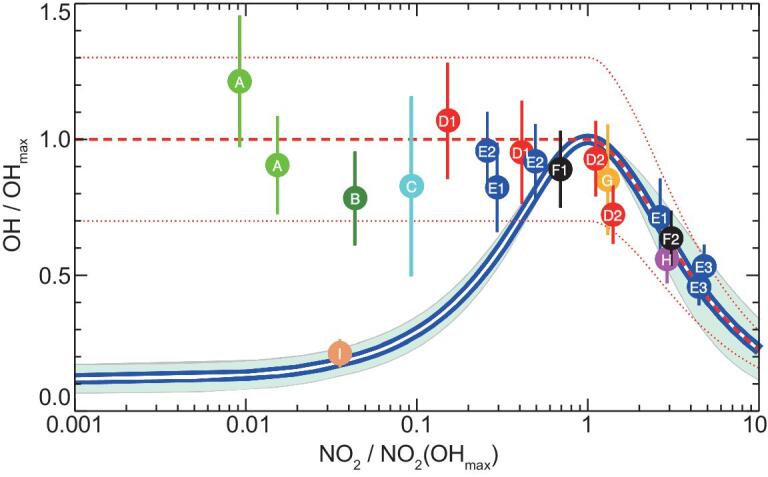
Figure 6.

Comparison of observed and calculated OH concentrations for high VOC environments. NO2 and OH concentrations are normalized as explained in the text. Letters denote results from thirteen campaigns with hydrocarbon reactivity higher than 10 s−1: (A) Amazonia averaged daytime and afternoon hours (2005); (B) Borneo (2008); (C) US deciduous forest (1998); (D1) Pearl River Delta (2006) morning and afternoon hours; (D2) Heshan (Pearl River Delta, 2014) morning and afternoon hours; (E1) Beijing (North China Plain, 2006) morning and afternoon hours; (F1) Mexico City (2003); (G) Tokyo (2004); (H) New York (2001); (F2) Mexico City (2006); (I) US ponderosa pine forest (2009); (E2) Wangdu (North China Plain, 2014) morning and afternoon hours; (E3) Huairou (North China Plain, 2016) morning and afternoon hours. Error bars denote stated accuracies. The light-blue shaded area denotes the range of model results for individual campaigns and the full white/blue line denotes the average of all model calculations. The thick dashed red line represents the new concept and the dotted red lines denote an error estimate of ±30%, which is a typical value for the observational constrained box model calculations of OH.
