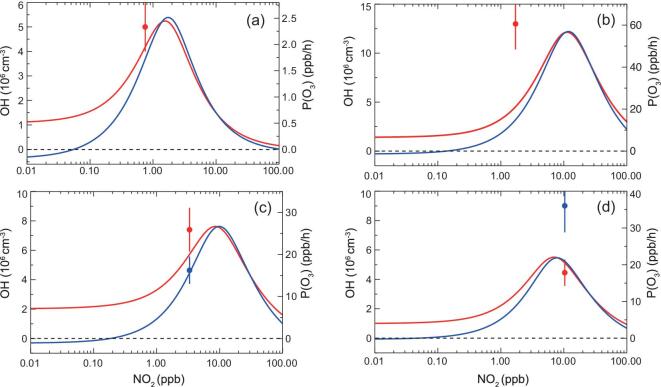
Figure 7.
Dependence of the OH concentration (red line) and the net ozone production rate (P(O3) (blue line) on NO2 calculated with a steady-state model with typical conditions of rural Germany (a), Pearl River Delta (b) and North China Plain (c) and (d). Red and blue circles denote the observed values of OH and P(O3), respectively.

