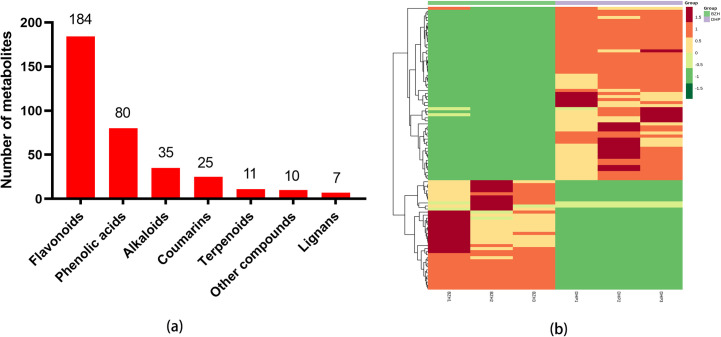
Fig 2.
(a) Classification of detected metabolites. (b) Heat-map of differential metabolites in C. reticulata ‘DHP’ and C. reticulata ‘BZH’. The up-regulated and down-regulated metabolites were expressed with different shade colors of red and blue, respectively. With the increase in the abundance value, the color of the bar presented from blue to red. When the abundance value was 0, the color of bar was white, as shown in the bar at the upper right.

