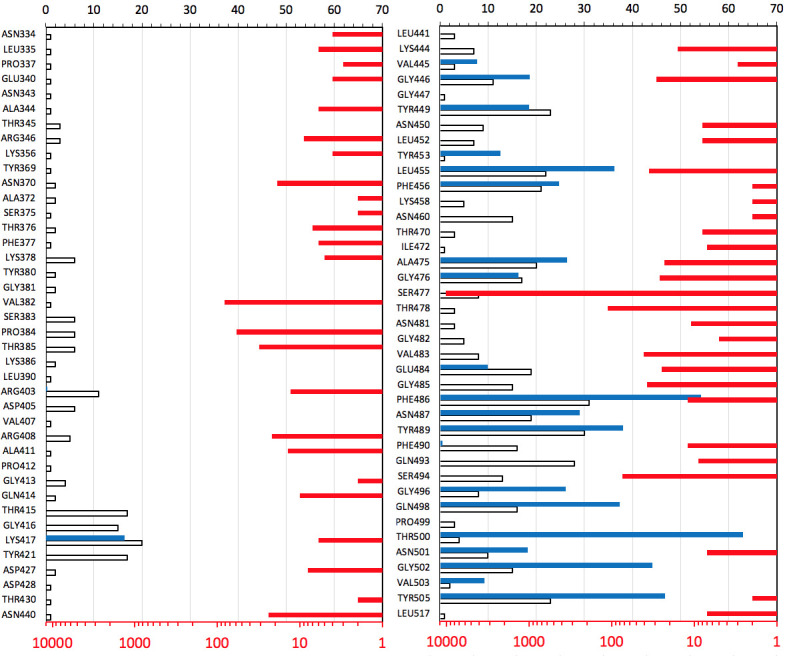
Fig 6. An overview of mutations in structurally characterized epitopes on RBD of SARS-CoV-2 spike protein.

The percentages of residue’s area in contact with ACE2 are shown as blue bars. The number of epitopes a residue is involved in is shown as white bars. The prevalence of missense mutations in epitopes is shown as red bars on the opposite (logarithmic) scale. For more details on mutations in currently structurally characterized epitopes, see S2 Fig.
