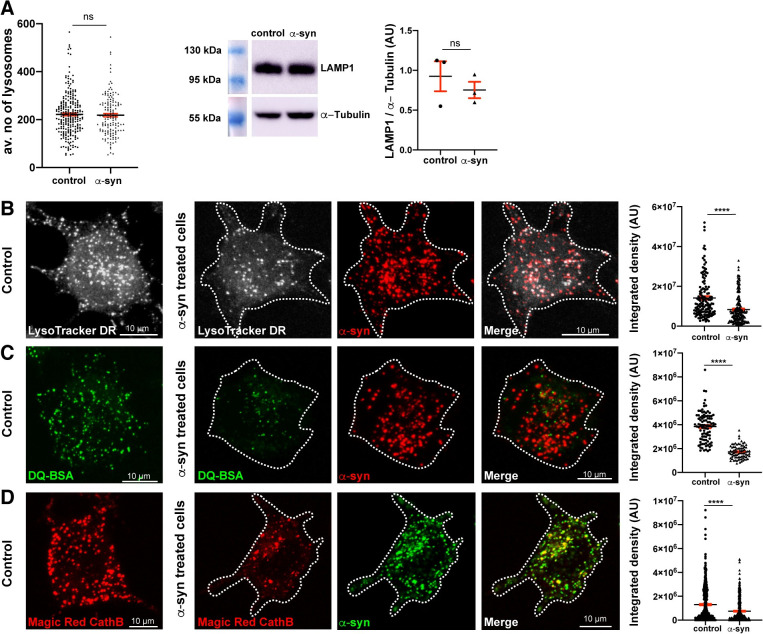
Fig 2. α-Syn fibrils affect the function of lysosomes.
(A) Average number of lysosomes (LAMP1+ puncta) per cell in control (222 ± 6) and in α-syn fibril-treated CAD cells for 18 hours (218 ± 7) is presented. Mean ± SEM, n = 5 (50 cells per condition). ns = not significant by Whitney–Mann U test (left panel). Western blot showing LAMP1 and α-tubulin expression in control and α-syn fibril-treated cells. Integrated density of LAMP1 protein expression levels normalized to α-tubulin in control (0.9 ± 0.2) and α-syn fibril-treated cells (0.7 ± 0.1) are presented in AU. Mean ± SEM, n = 3. ns = not significant by paired t test. (B) Representative confocal images of control and Alexa 568–tagged α-syn fibrils challenged CAD cells (18 hours), labeled with LysoTracker DR (20 nM for 20 minutes; LysoTracker DR is pseudo colored in gray). Dashed lines represent the cell contour. Average integrated density of control cells (1.4 × 10⁷ ± 9 × 10⁵) and α-syn fibril-treated cells (8.3 × 10⁶ ± 5 × 10⁵) is presented. Mean ± SEM, n = 3 (40 cells per condition). ****P < 0.0001 by Mann–Whitney U test. Scale bar: 10 μm. (C) Representative confocal images of control and Alexa 568–tagged α-syn fibrils (red) challenged CAD cells for 18 hours, treated with DQ-BSA (green) for 90 minutes. Dashed lines represent the cell contour. Average integrated density measured for control cells (3.8 × 10⁶ ± 1 × 10⁵) and α-syn fibril-treated cells (1.7 × 10⁶ ± 6 × 10⁴) is presented. Mean ± SEM, n = 3 (25 cells per condition). ****P < 0.0001 by Mann–Whitney U test. Scale bar: 10 μm. (D) Representative confocal images of control and Alexa 488-tagged α-syn fibrils (green) challenged CAD cells for 18 hours treated with 1X Magic Red CathB (red). Dashed lines represent the cell contour. Average integrated density measured for control cells (1.3 × 10⁶ ± 6 × 10⁴) and α-syn fibril-treated cells (7.5 × 10⁵ ± 5 × 10⁴) is presented. Mean ± SEM, n = 5 (100 cells per condition). ****P < 0.0001 by Mann–Whitney U test. Scale bar: 10 μm. The data underlying this figure may be found in S1 Data. α-syn, α-synuclein; AU, arbitrary unit; CAD, Cath.a-differentiated; CathB, Cathepsin B; LAMP, lysosome-associated membrane protein; LysoTracker DR, LysoTracker Deep Red.

