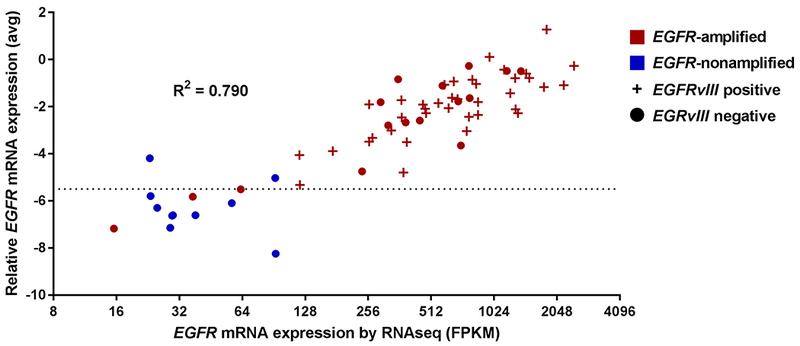
Figure 4. EGFR expression by RNAseq and RT-PCR are comparable.

Correlation between RNAseq (x-axis, log2 scale; FPKM, fragments per kilobase million.) and RT-PCR (y-axis, ΔCt, linear scale) results in 64 tumor samples. Horizontal dotted line at −5.50 delineates cut-off between EGFR-positive (above line) and -negative (below line) samples. Colors indicate EGFR amplification as determined by FISH, symbol indicates EGFRvIII mutation (present +, absent •), with mutation detected exclusively among EGFR-amplified tumors.
