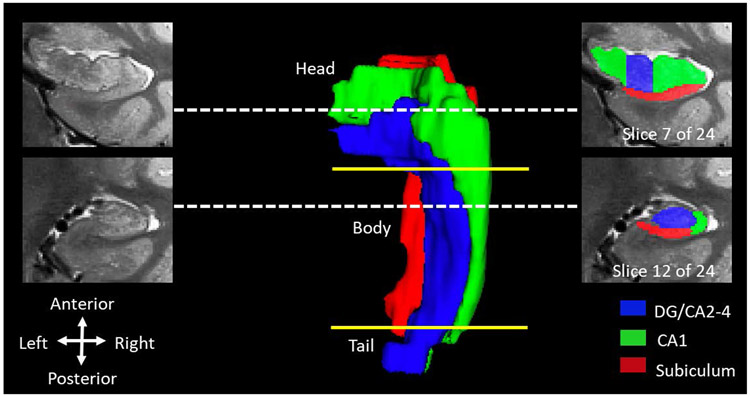
Figure 1. Hippocampal volume from one representative participant.
(age 4.54 years), including subregions (head, body, tail) and subfields (CA1-4, subiculum, dentate gyrus or DG). Note the disproportionate distribution of subfields along the longitudinal axis. Dotted lines indicate exact location of coronal slices. Yellow lines indicate approximate boundaries between subregions.

