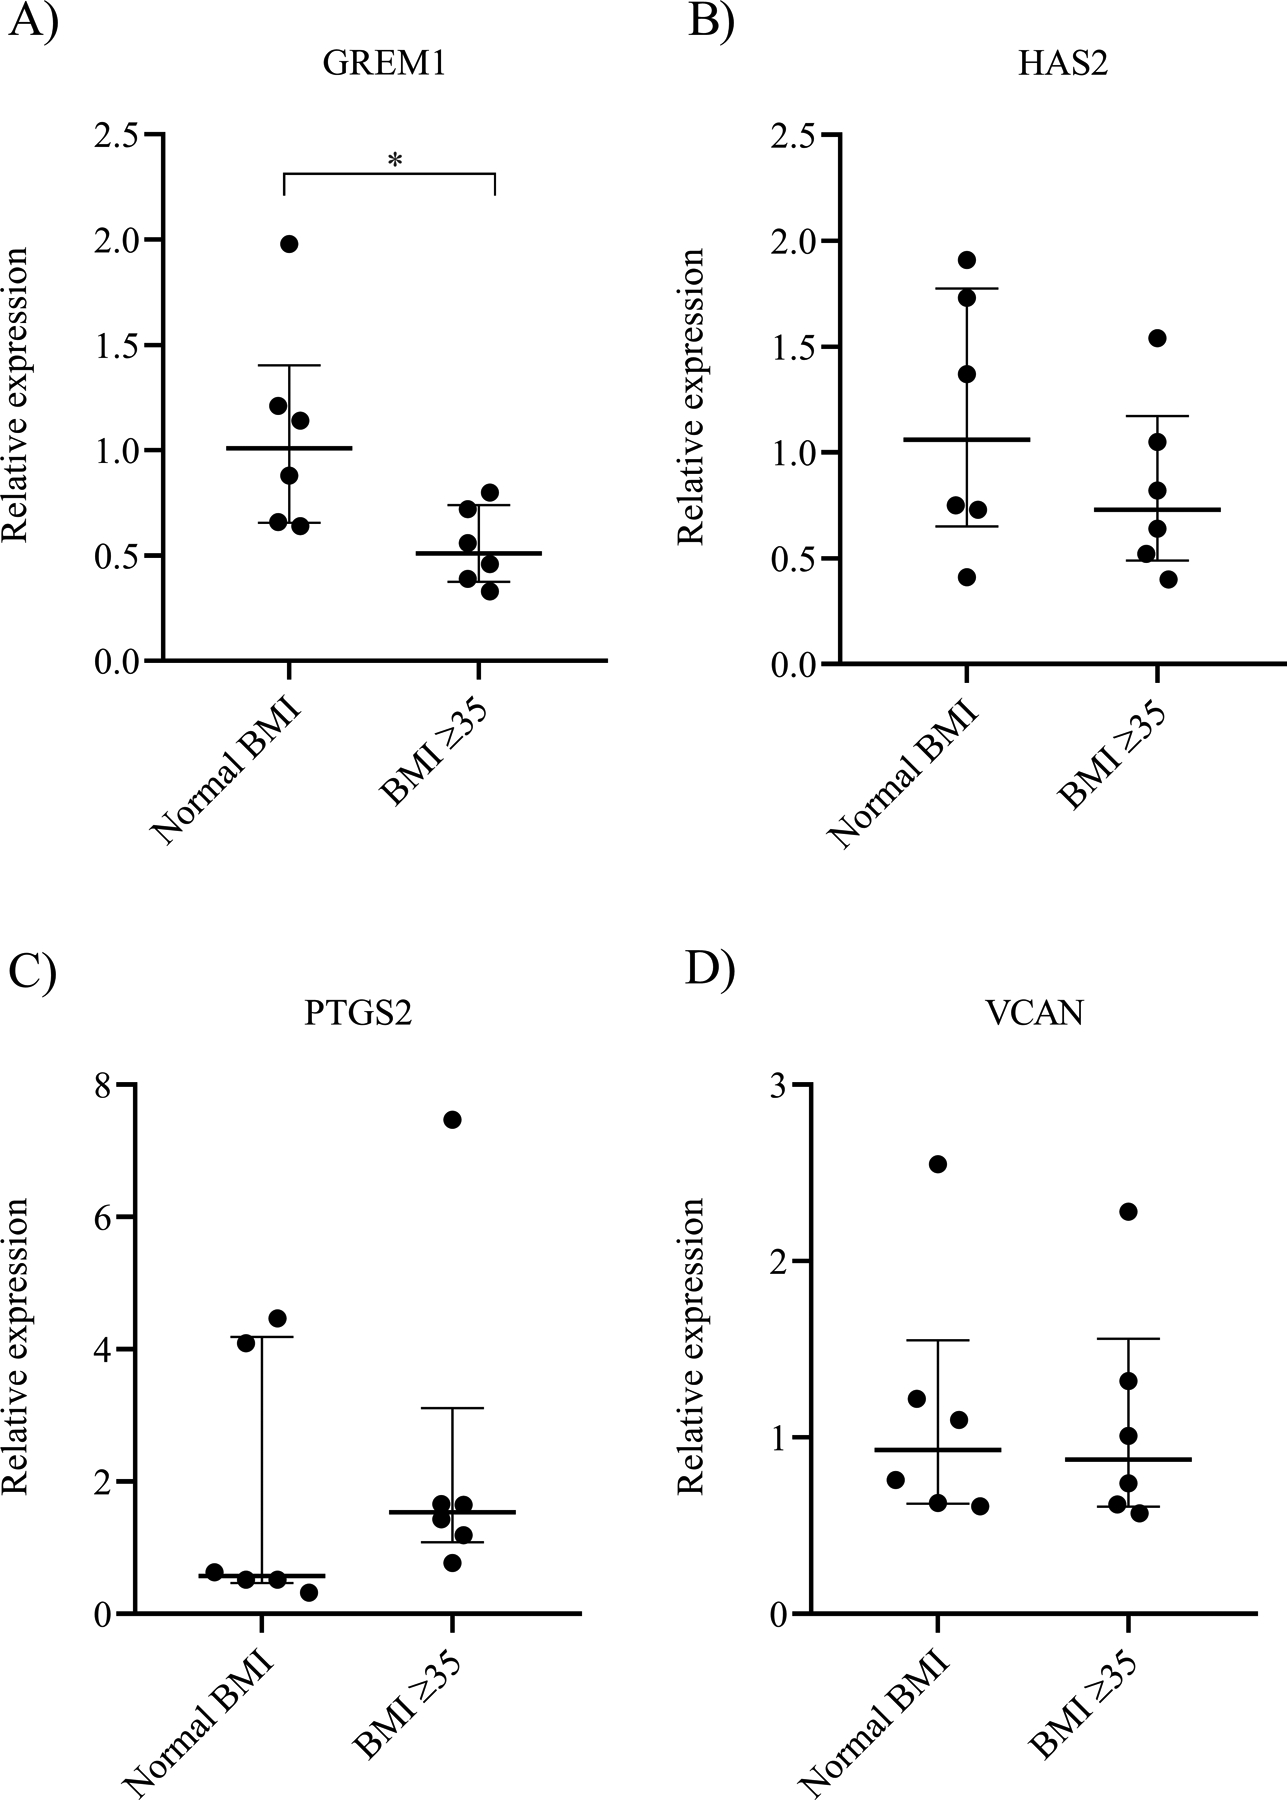
Figure 1. Relative gene expression of cumulus cells isolated from women with normal BMI and BMI ≥35 kg/m2.

Gene expression levels of A) GREM1, B) HAS2, C) PTGS2, and D) VCAN in each cohort. The graphs represent the median value with first and third interquartile ranges. Data were compared by Mann Whitney U test (N=6 women/group). * indicates p<0.05.
