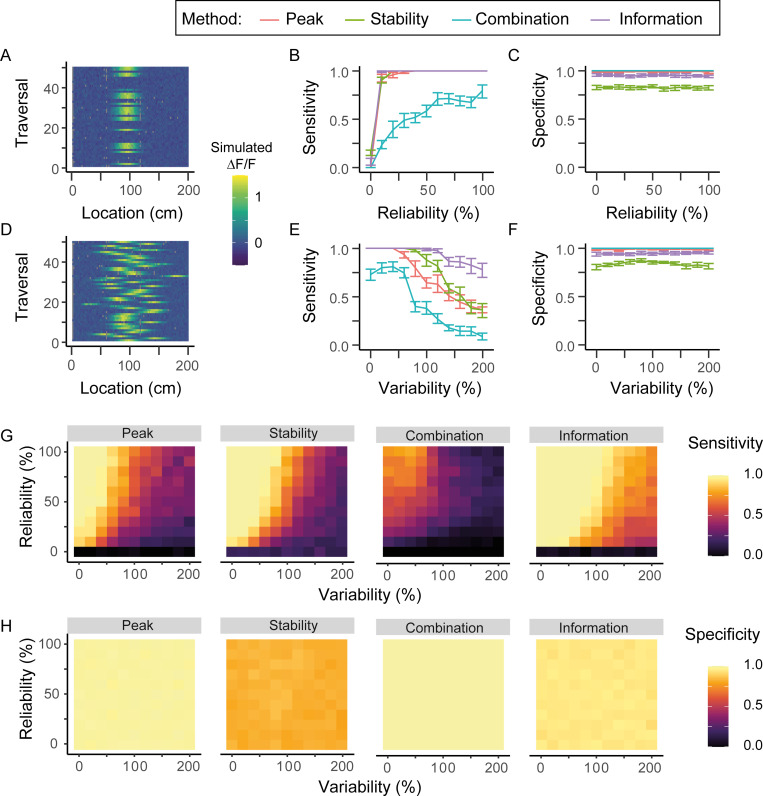
Fig 3. Place cell identification in variable and unreliable place cells.
(A) Fluorescence map for a place cell with a reliability of 40% (B) Sensitivity of methods as a function of the reliability of a place cell. (C) Specificity of methods as a function of reliability. (D) Fluorescence map for a place cell with 60% variability. (E) Sensitivity of methods as a function of the variability of a cell’s place field across different traversals. (F) Specificity of methods as a function of variability. (G) Surface plots of the sensitivity of each method as a function of both reliability and variability. (H) Surface plots of the specificity of each method as a function of both reliability and variability. Grey points in A and D indicate the mouse did was not recorded at that location in that particular traversal, due to the limited frame rate of our recordings. Data shown are the means of 10 randomly created datasets, with the error bars representing 95% confidence intervals.

