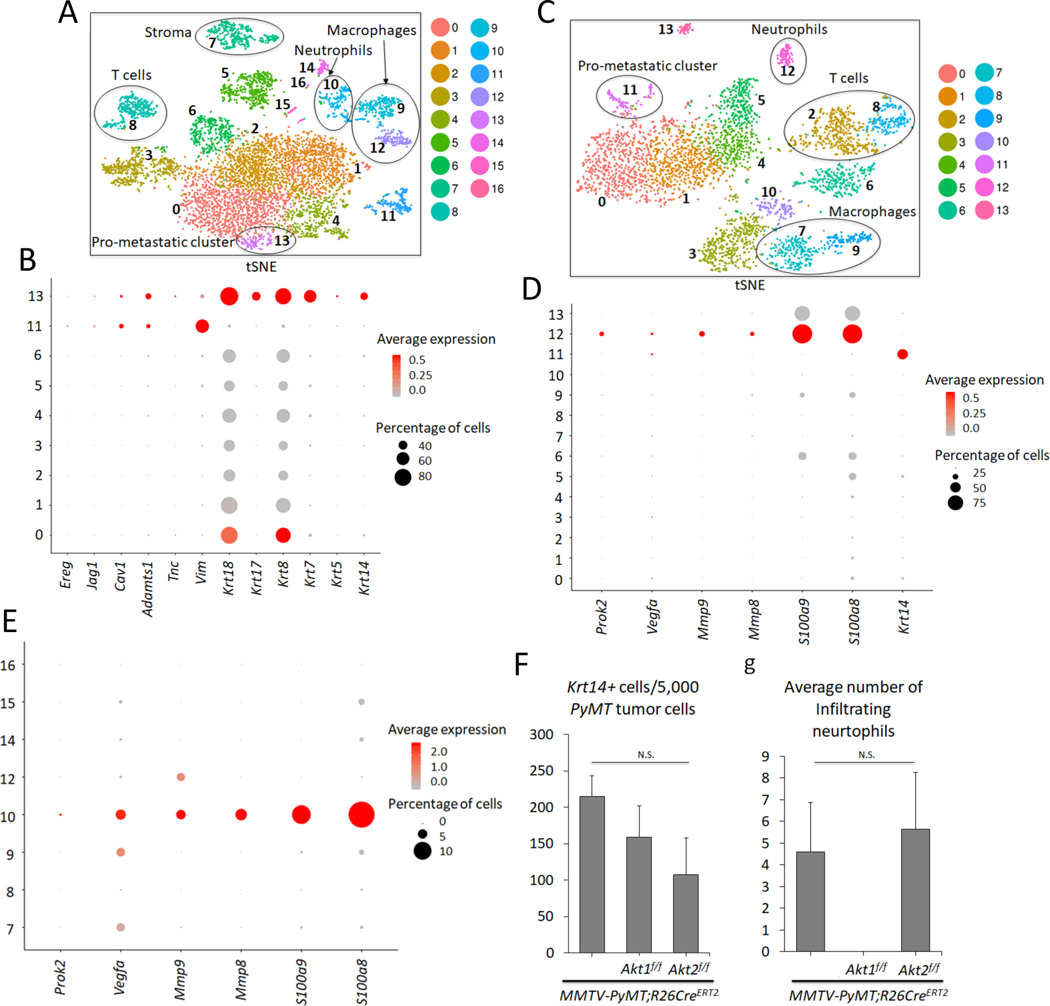
Figure 4. Analysis of primary and metastatic tumors by scRNA-seq.
A. t-Distributed Stochastic Neighbor Embedding (t-SNE) plot of primary mammary gland tumors in MMTV-PyMT mice. Each cluster is characterized by a unique gene expression signature. A total of 7,791 primary breast tumor cells (N = 5) were used. Clusters 0, 1, 2, 3, 4, 5, 6, 11, and 13 are tumor cells expressing PyMT, whereas the remaining clusters are non-tumor cells. The clusters are color-coded. B. Dot plot showing expression of metastatic markers Ereg, Jag1, Cav1, Adamts1, Tnc, Vim, as well as Krt18, Krt17, Krt8, Krt7, Krt5, and Krt14 across the PyMT primary tumor clusters. C. tSNE plot of 3,979 metastatic tumor cells in the lung (N = 3). Clusters 0, 1, 4, 5 and 11 are PyMT-positive. D. Dot plot depicting expression of Prok2, Vegfa, Mmp9, Mmp8, S100a9, S100a8, and the prometastatic marker Krt14 across the clusters in the lung metastatic scRNA-seq analysis. E. Dot plot in the primary non-tumor clusters indicate that cluster 10 has a predominant gene expression profile of neutrophil markers Prok2, Vegfa, Mmp9, Mmp8, S100a9, S100a8. F. Graph showing the average number of pro-metastatic Krt14-positive cells for every 5,000 PyMT-positive tumor cells based on the scRNA-seq results. N(MMTV-PyMT) = 5, N(MMTV-PyMT; Akt1f/f) = 3, N(MMTV-PyMT; Akt2f/f) = 3. N. S = not significant (p>0.05). One-way analysis of variance (ANOVA) was used to calculate significance. G. Graph showing the average number of infiltrating neutrophils in each genotype. scRNA-seq reveals the absence of neutrophil cells in primary systemic Akt1 knockout tumors across all 3 biological replicates. N(MMTV-PyMT) = 5, N(MMTV-PyMT; Akt1f/f) = 3, N(MMTV-PyMT; Akt2f/f) = 3. N.S = not significant (p>0.05). One-way ANOVA was used to calculate significance. Error bars represent standard error.

