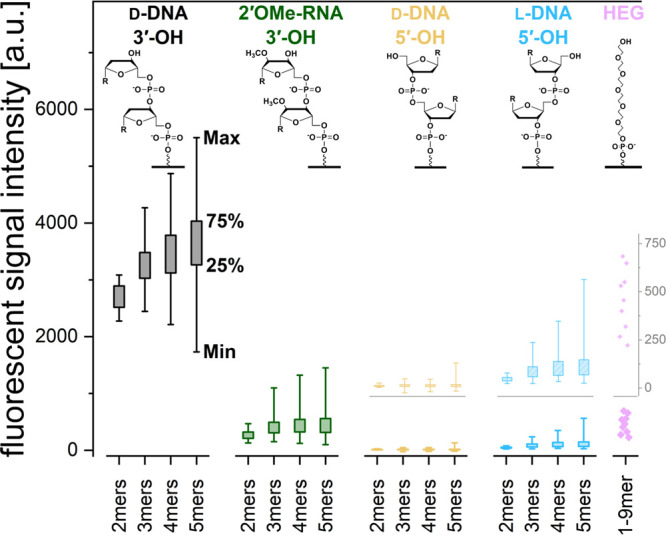
Figure 2.

Fluorescent signal intensities after background subtraction for five different types of initiating strands. The structure of the corresponding dimer (monomer for HEG), immobilized to the surface is illustrated. For each type and length of oligonucleotide strands, the 0th, 25th, 75th, and 100th intensity percentiles are shown, based on all possible 4n data points for each initiator strand of length n. Hexaethylene glycol n-mers are plotted with dots. The greyed-out insert for 5′-OH d-DNA, 5′-OH l-DNA, and HEG shows this lower range of signal intensity in more detail.
