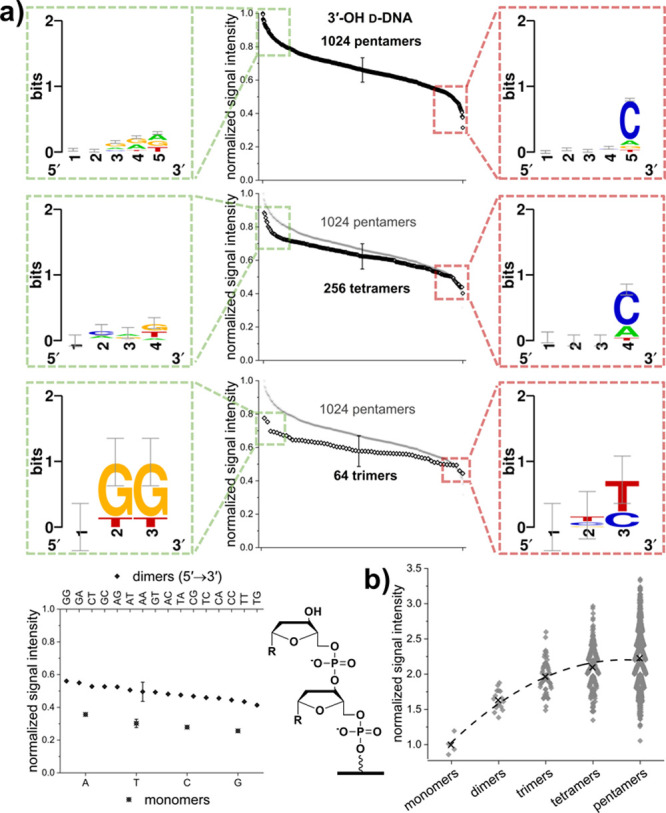
Figure 3.

Analysis of extension of 3′-OH d-DNA initiating strands. (a) Fluorescent signal intensities were normalized to the maximum and clustered according to length, with representative SEM error bars. Panels to the left illustrate sequence patterns (5′ → 3′ direction) from the data for the 10% highest signal intensities framed in green, whereas panels to the right show the data for the 10% lowest signal intensities for penta-, tetra-, and trimers (top to bottom) framed in red. Data for pentamers are repeated in gray in the subsequent plots for comparison. For monomers and dimers, data are plotted from highest to lowest signal intensity with the corresponding sequence specified by the labeling of the top and bottom x-axis for dimers and monomers, respectively. Next to this plot, the chemical structure of a dimer immobilized to the glass surface serves as a guide for straightforward identification of differences between the chemical variants tested for initiation in this and subsequent figures. (b) Fluorescent signal intensities normalized to the average of all monomers and clustered according to strand length. Averages for each strand length are indicated by an “×”. The dotted second order polynomial fit through the averages serves as a visual guide.
