
Figure 6.
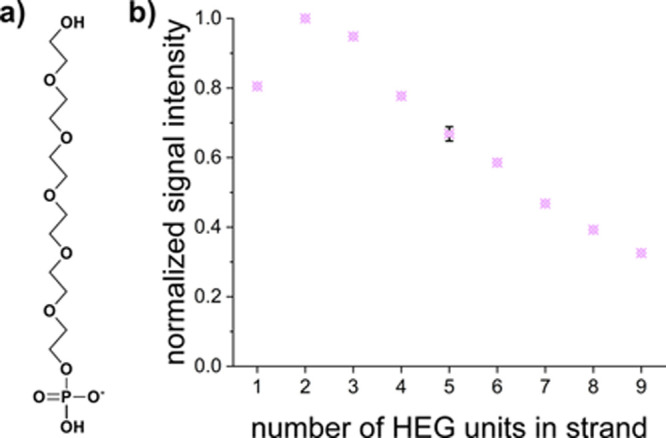
Extension of hexaethylene glycol strands. (a) Molecular structure of a single HEG unit. (b) Fluorescent signal intensities, normalized to maximum signal detected for dimers, show a decreasing trend with increasing number of HEG units in the initiating strand (error bar representative for SEM).