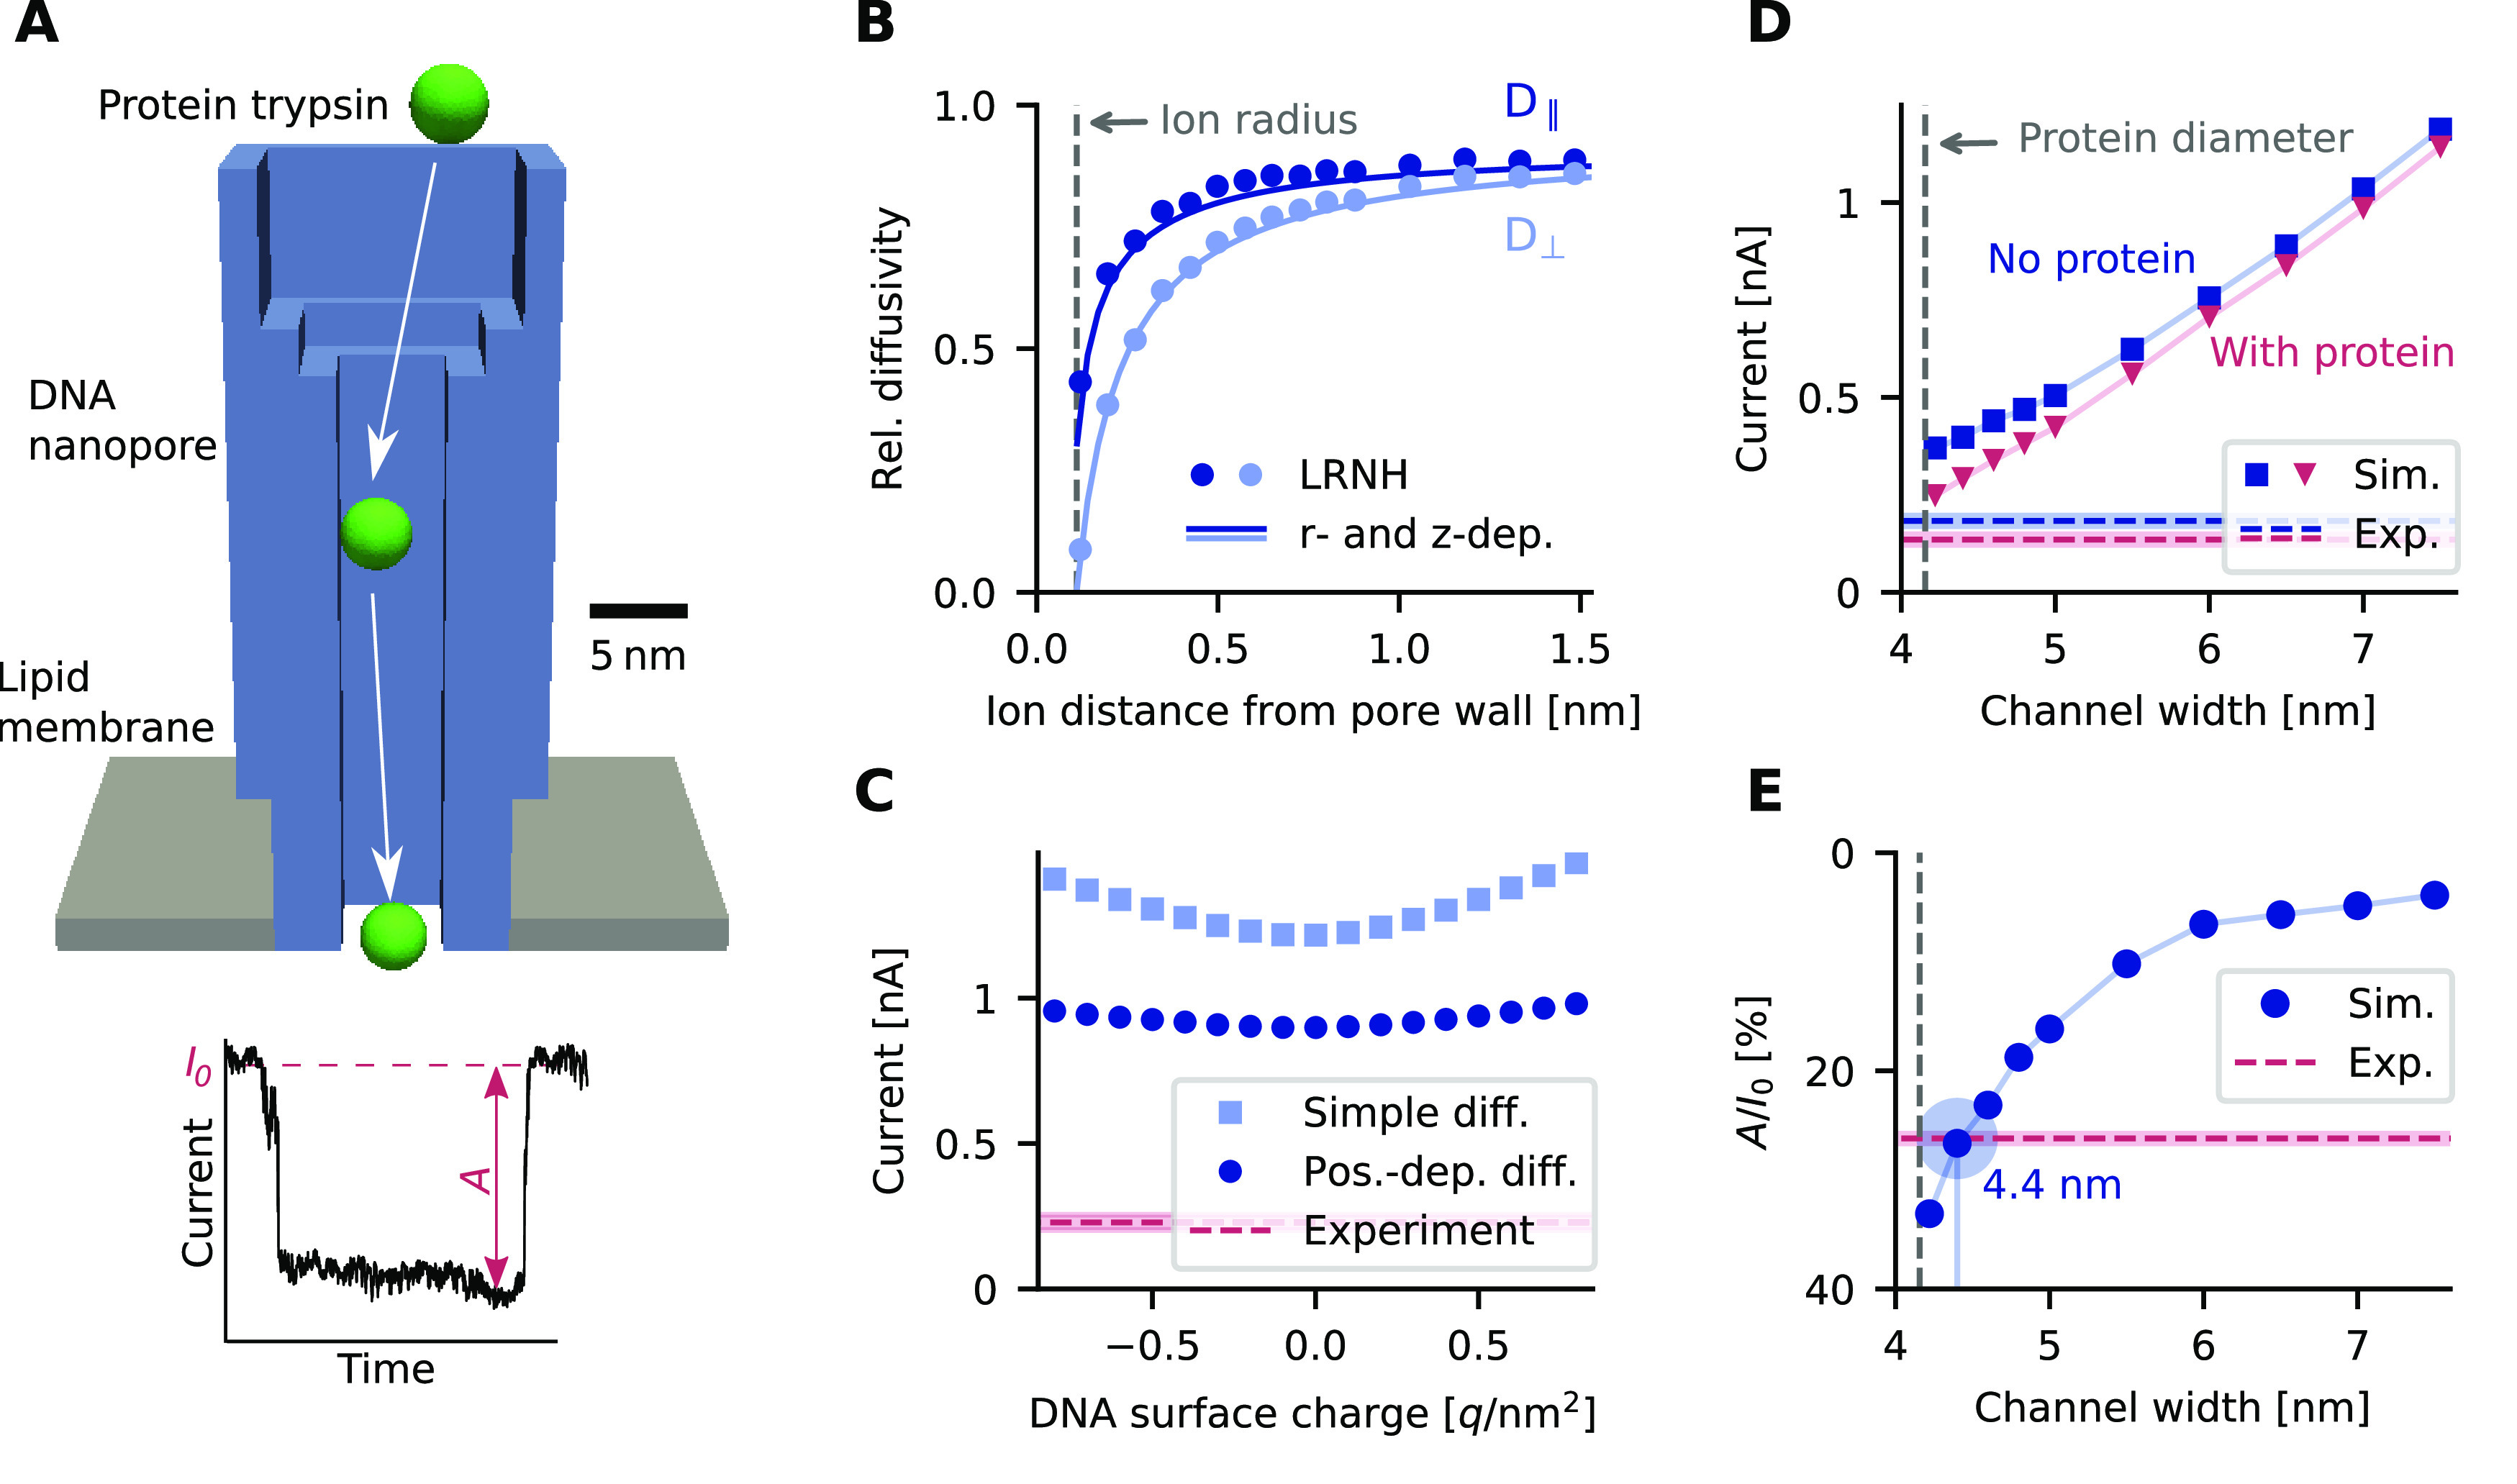
Figure 4.

Ion diffusivity and ion currents in a DNA nanopore. (A) Model of a DNA origami nanopore from ref (36) and a schematic current trace. (B) Tangential (D∥) and normal diffusivity (D⊥) of K+ ions in the channel for different diffusivity models. (C) Simulated ion current as a function of DNA surface charge and diffusivity. Dark blue circles: position-dependent diffusivity model used elsewhere in the paper. Light blue squares: simpler, piece-wise constant model where diffusivity takes a constant value in the pore computed for the pore center and another constant value in the bulk. Dashed lines in this and panels D and E are the experimental values from recordings using a pore described in ref (36); shaded areas indicate the variation in measurements. The voltage bias is −100 mV and the electrolyte is 1 M KCl. (D) Simulated ion current as a function of channel width, with (red triangles) and without (blue squares) protein at the pore center. The corresponding measurements are indicated by a dashed line. The voltage bias is −80 mV at 1 M KCl. (E) Relative current blockade with a protein in the pore lumen, as computed from panel D.
