
Figure 3.
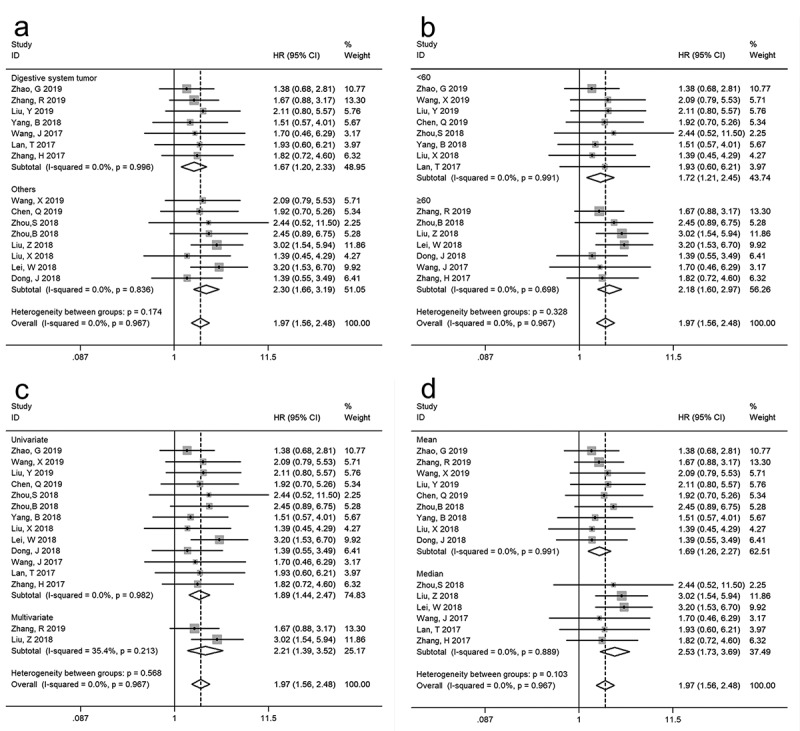
Stratified analyses of SNHG12 expression on overall survival according to subgroups: (a) tumor type, (b) sample size, (c) survival analysis method and (d) cutoff value
Official websites use .gov
A
.gov website belongs to an official
government organization in the United States.
Secure .gov websites use HTTPS
A lock (
) or https:// means you've safely
connected to the .gov website. Share sensitive
information only on official, secure websites.
Stratified analyses of SNHG12 expression on overall survival according to subgroups: (a) tumor type, (b) sample size, (c) survival analysis method and (d) cutoff value