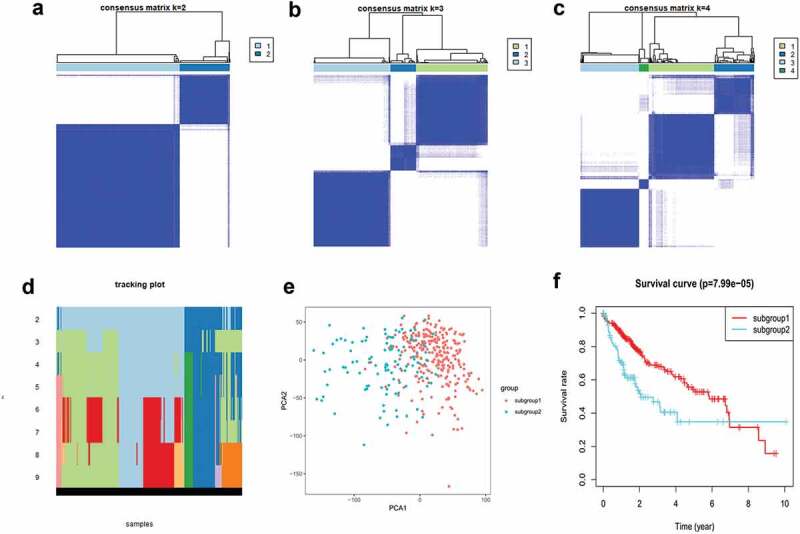
Figure 3.

Identification and analysis of two subgroups of 374 tumor samples that exhibited distinct m6A expression. (a–c) Consensus clustering matrix for k = 2, 3, and 4. (d) Tracking plot for k = 2 to 9. (e) Principal component analysis (PCA) of the two subgroups. (f) Kaplan–Meier survival plots of the two subgroups.
