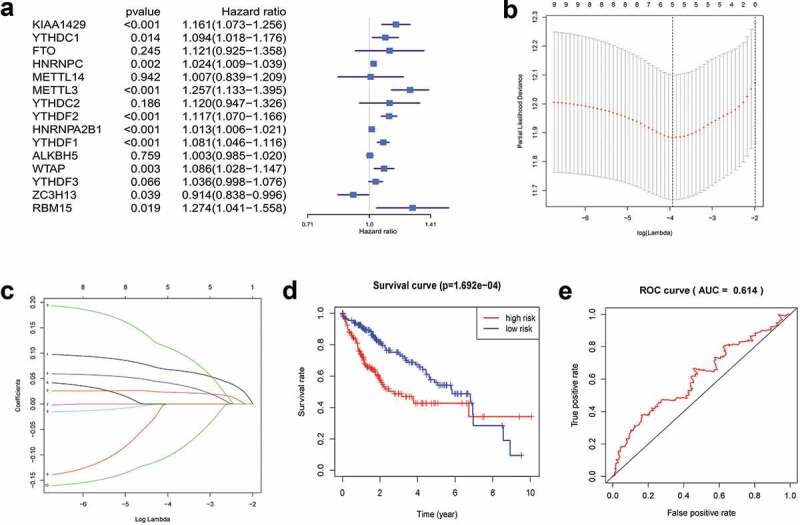
Figure 4.

Gene selection and survival analysis in HCC prognosis prediction. (a) Forest plots for hazard ratios (HRs) of survival‑associated m6A methylation-related genes in HCC. (b) Partial likelihood deviance versus log (λ)was drawn using LASSO Cox regression model. (c) Coefficients of selected features are shown by lambda parameter. (d) Kaplan–Meier survival plots of the two groups. (e) ROC curves of the survival model in HCC (AUC = 61.4%).
