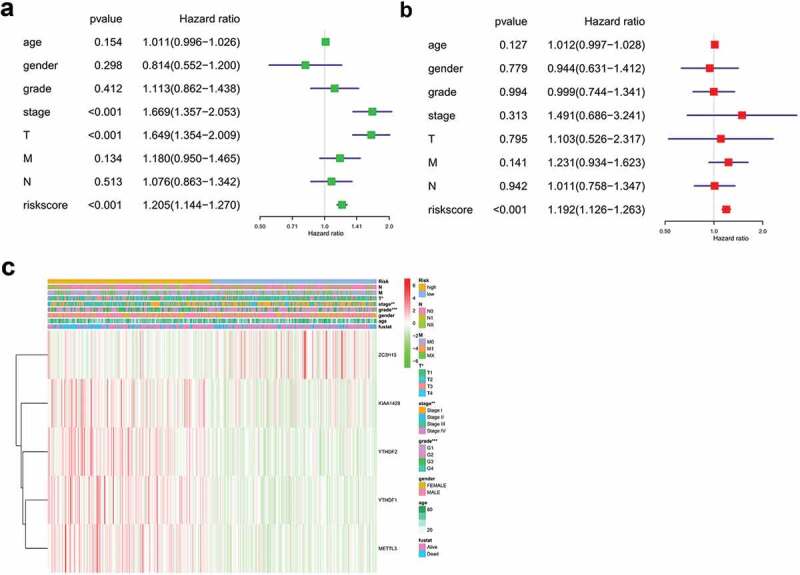
Figure 5.

Forest plot and heatmap of m6A methylation-related genes and clinical risk factors. (a) Forest plot of univariate Cox regression analysis in HCC. (b) Forest plot of multivariate Cox regression analysis in HCC. (c) Heatmap of m6A methylation-related genes and clinical risk factors.(***P < 0.001, ** P < 0.01, *P < 0.05).
