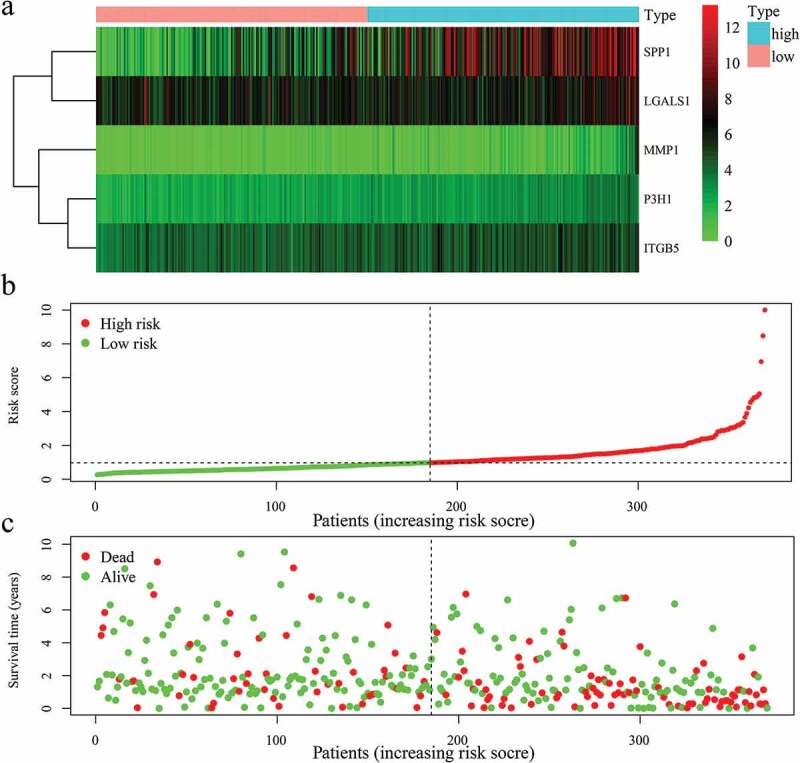
Figure 5.

The risk score constructed by 5 EAGs to predict OS in HCC patients. (a) Heatmap of 5 EAGs’ expression profile between high and low-risk groups. (b) The risk score distribution of HCC patients. (c) Correlations between survival times and the survival status of HCC patients. OS: overall survival rates.
