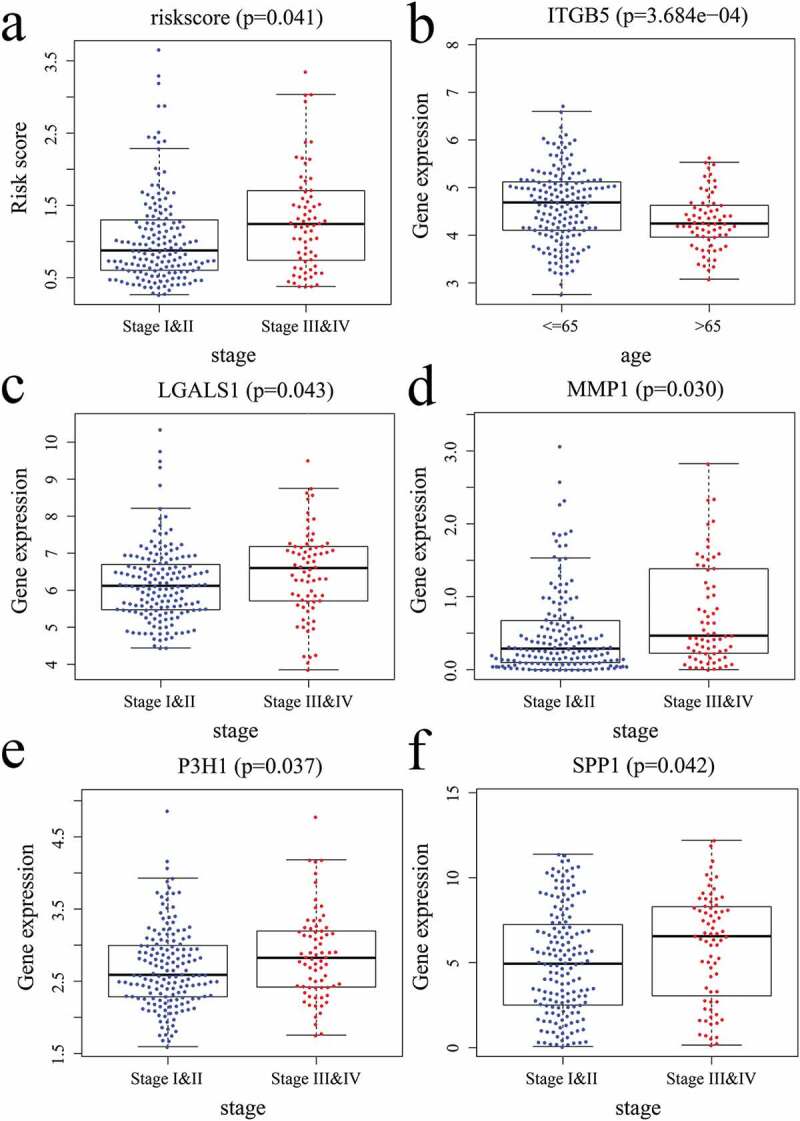
Figure 7.

Correlations between the risk score/5 EAGs and patient’s clinical features. (a) risk score and pathology stage. (b) ITGB5 expression level and age. (c) LGALS1 expression level and pathology stage. (d) MMP1 expression level and pathology stage. (e) P3H1 expression level and pathology stage. (f) SPP1 expression level and pathology stage.
