
Figure 8.
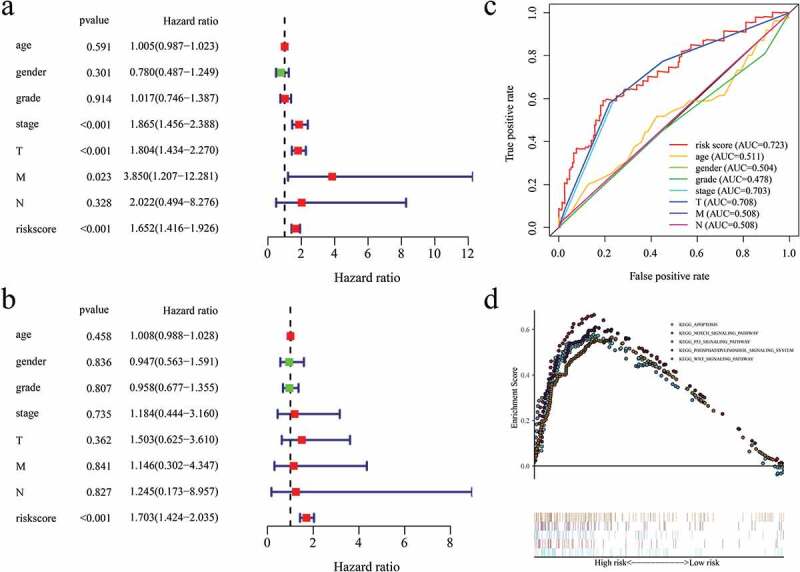
(a) Univariate Cox regression analysis of risk score in HCC. (b) Multivariate Cox regression analysis of risk score in HCC. (c) ROC curves comparing the prognosis predictive value of the risk model and different clinical features in HCC. (d) KEGG pathway analysis of 5 identified EAGs.