
Figure 2.
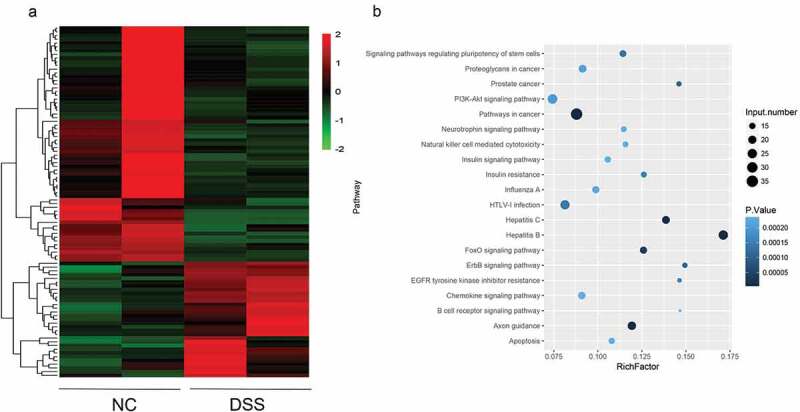
Differentially expressed miRNAs in UC micescreened by RNA sequencing. (a) Heat map showing an overview of differentially expressed miRNAs obtained from RNA sequencing data.The red and blue scales represent higher or lower expression levels, respectively. (b) KEGG pathway enrichment analysis showing the potential functions of these differentially expressed miRNAs and the pathways they may possibly be involved in.