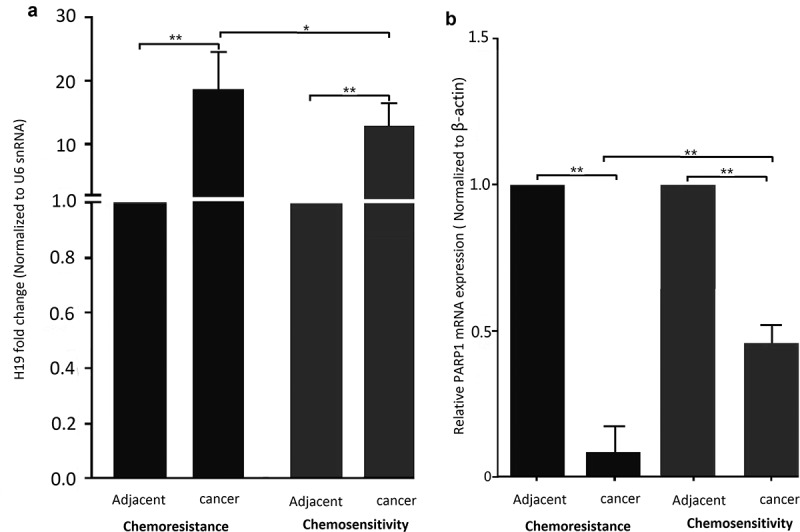
Figure 1.

H19 contributes to chemoresistance in breast cancer tissues and cell lines. (a) qPCR analysis showed that H19 expression levels were higher in patients with chemotherapy resistance than that of patients with chemotherapy sensitivity, H19 expression levels were higher in patients with breast cancer than that of their parental. (b) qPCR analysis showed that PARP1 expression levels were lower in patients with chemotherapy resistance than that of patients with chemotherapy sensitivity, PARP1 expression levels were lower in patients with breast cancer than that of their parental. *P < 0.01,**P < 0.001
