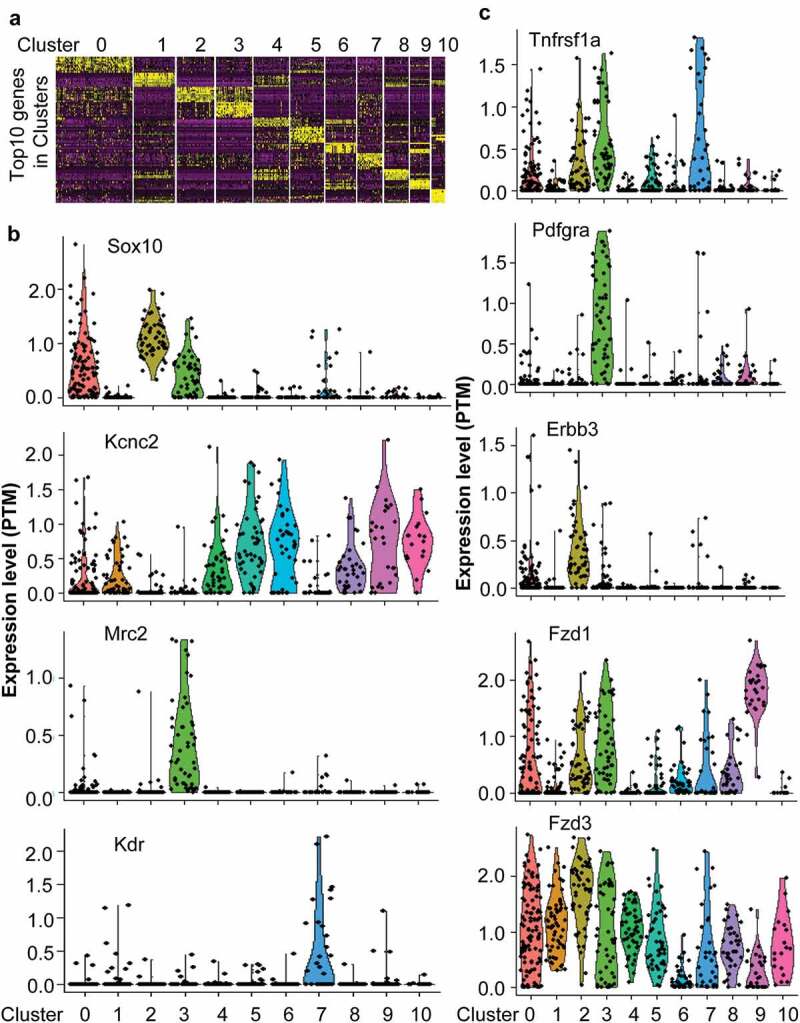
Figure 5.

The single-cell RNA-seq data unveiled receptor expression in different subpopulation cells. (a) Single-cell RNA-data indicated that DRG composed of 11 clusters labeled from 0 to 10. (b) The specific markers to define different subpopulation cells. (c) The expression of paracrine factor receptors including Tnfrsf1a, Pdgfra, Erbb3, Fzd1, and Fzd3 in different subpopulation cells.
